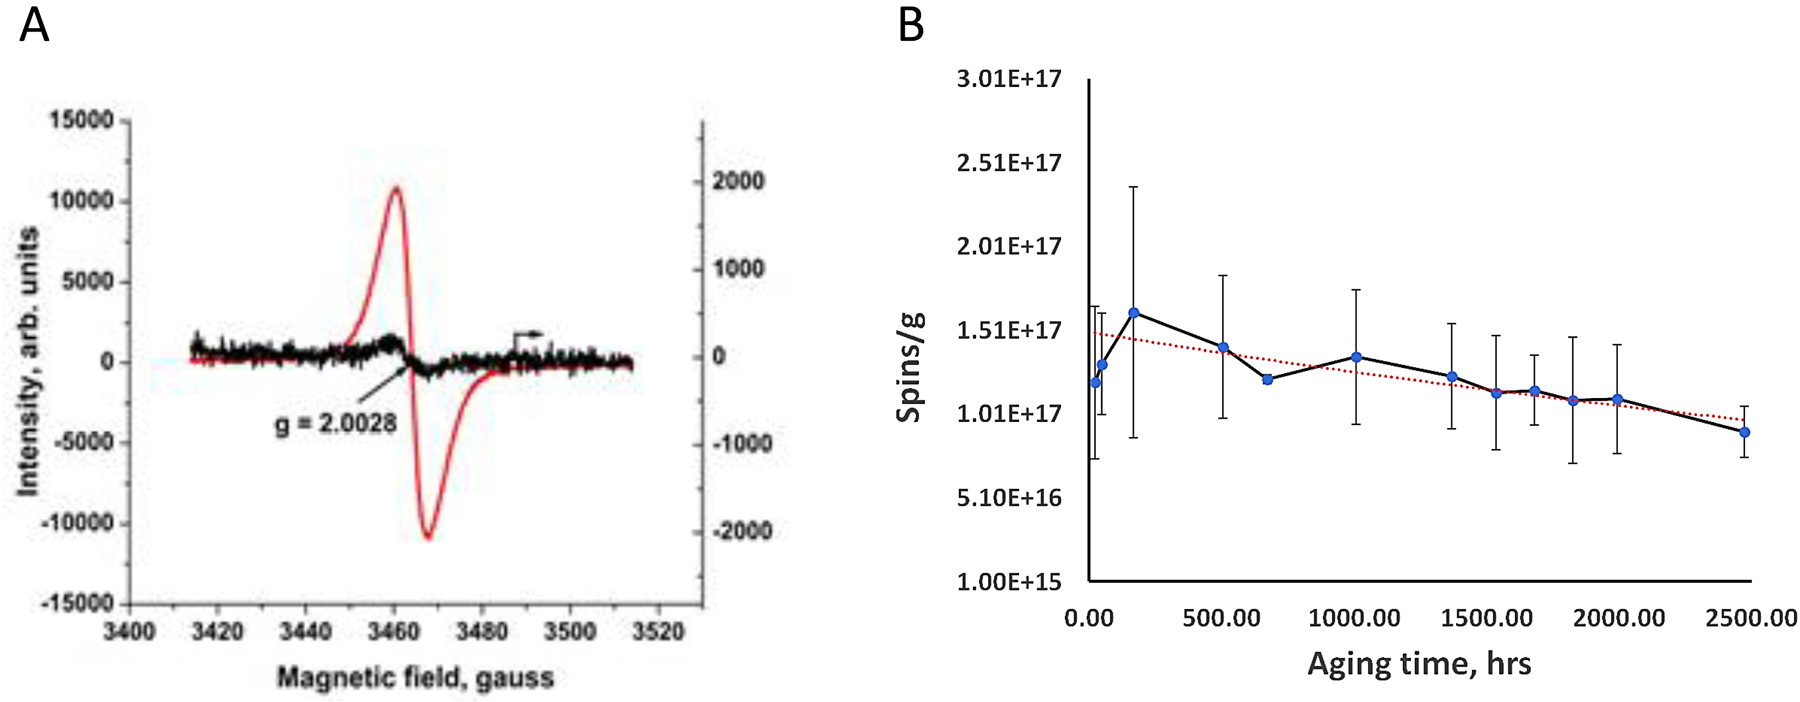
Figure 2:

A) EPR spectra obtained from EPFR hi and lo samples to determine the intensity of their radical signal (red curve represents EPFR hi and black curve represents EPFR lo). EPFRs display an asymmetrical g value (2.0028–2.0032) with a broad peak (ΔHp-p ~6 –10 Gauss). B) Rate of radical decay. Spins/g for an EPFR hi sample was plotted over time between June 30th and September 9th, 2020, and the rate of decay calculated to determine half-life of the radicals (red dashed line).
