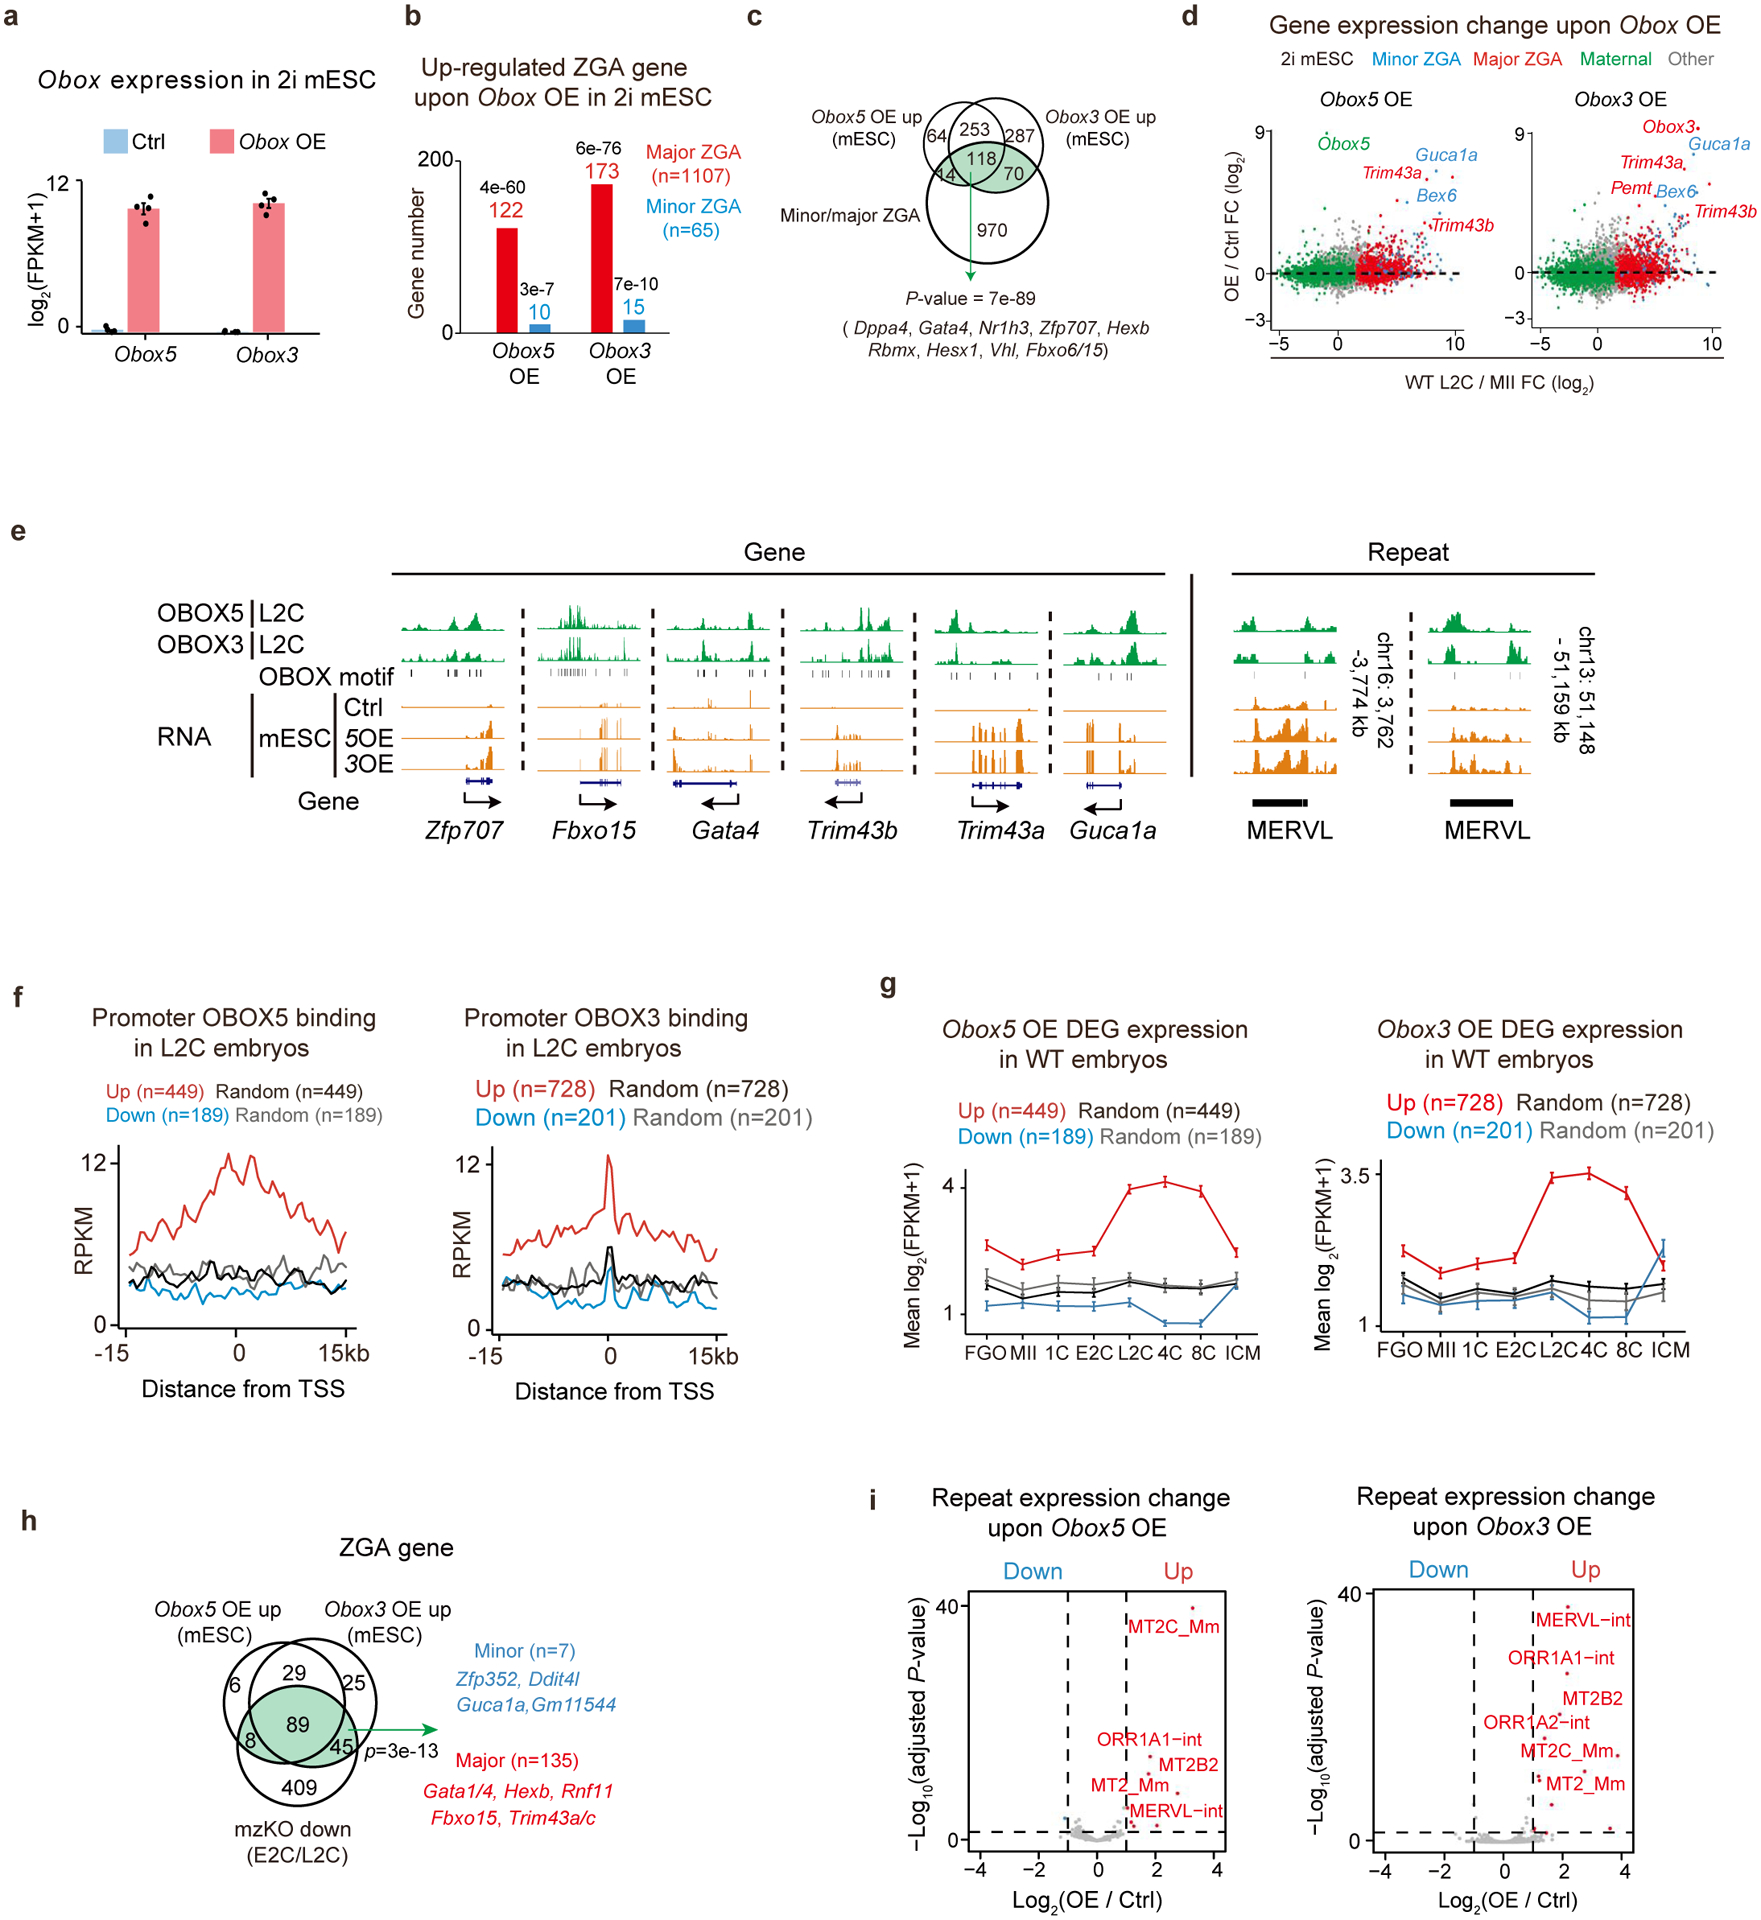
Extended Data Fig. 9 |. Obox overexpression activated ZGA genes and MERVL in 2i mESCs.

a, Obox expression levels upon overexpression in 2i mESCs (4 biological replicates). Error bars, mean ±SE. b, Bar chart showing the activated ZGA gene numbers upon Obox overexpression in 2i mESCs (4 biological replicates). P-values, two-sided Fisher’s exact test. c, Venn diagram showing the overlaps among Obox OE upregulated genes in 2i mESCs and ZGA genes. P-value, two-sided Fisher’s exact test. Green indicates the combined ZGA gene list activated by OBOX3/5. d, Scatter plot showing gene expression fold-changes upon Obox overexpression in 2i mESCs (4 biological replicates). e, OBOX binding at example OBOX-activated ZGA genes and MERVL in embryos. OBOX motif and RNA levels are shown. f, OBOX binding enrichment in embryos at the promoters of differentially expressed genes (DEGs) upon Obox overexpression in 2i mESCs. g, Line charts showing DEG upon Obox overexpression in 2i mESCs (4 biological replicates) for their expression in oocytes and embryos. Error bars, mean ± SE. n, gene number. h, Venn diagram showing the overlap between Obox activated ZGA genes in 2i mESCs (4 biological replicates) and downregulated ZGA genes in Obox mzKO embryos (2 biological replicates for E2C and 3 for L2C)). P-value, two-sided Fisher’s exact test. Green indicates the combined ZGA gene list activated by OBOX3/5 and downregulated in Obox mzKO embryos. i, Volcano plot showing the repeat expression changes upon Obox overexpression in 2i mESCs (4 biological replicates). Dashed line, adjusted P-value threshold 0.05.
