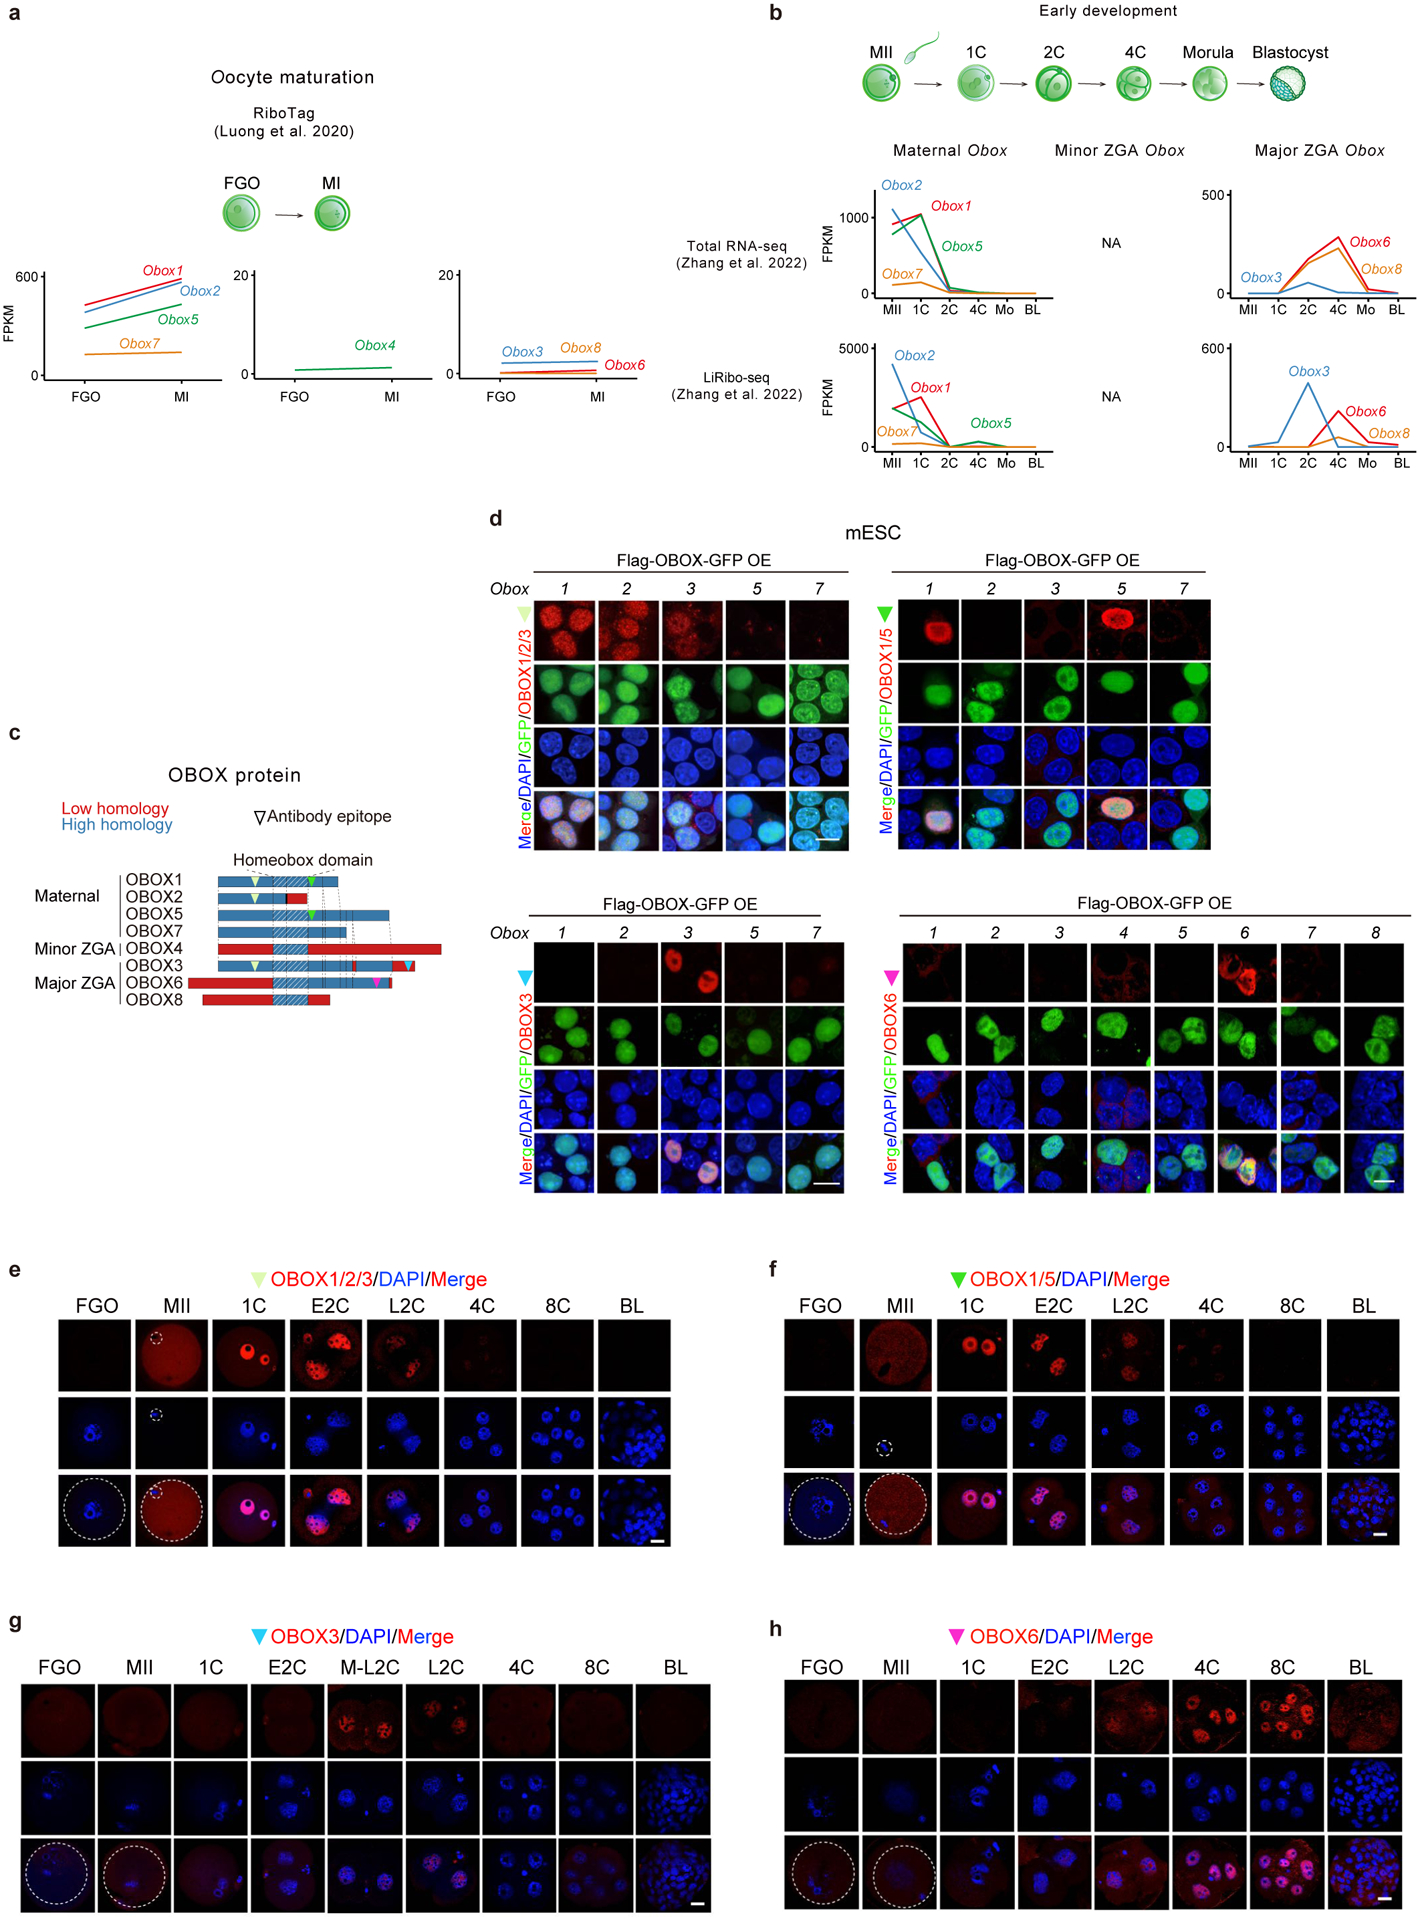
Extended Data Fig. 2 |. OBOX protein levels in oocytes and early embryos.

a-b, Line plots showing Obox mRNA and translation levels during oocyte maturation (2 biological replicates) and early embryo development (2 biological replicates) based on datasets from the previous publications30,31. NA, data not available. c, OBOX antibody epitope locations. d, Immunofluorescence showing OBOX signals detected by OBOX antibodies upon Flag-OBOX-GFP overexpression in mESCs (2 biological replicates). Scale bar, 10μm. e-h, OBOX immunofluorescence in mouse oocytes and embryos (3 biological replicates). BL, blastocyst. Scale bar, 20 μm.
