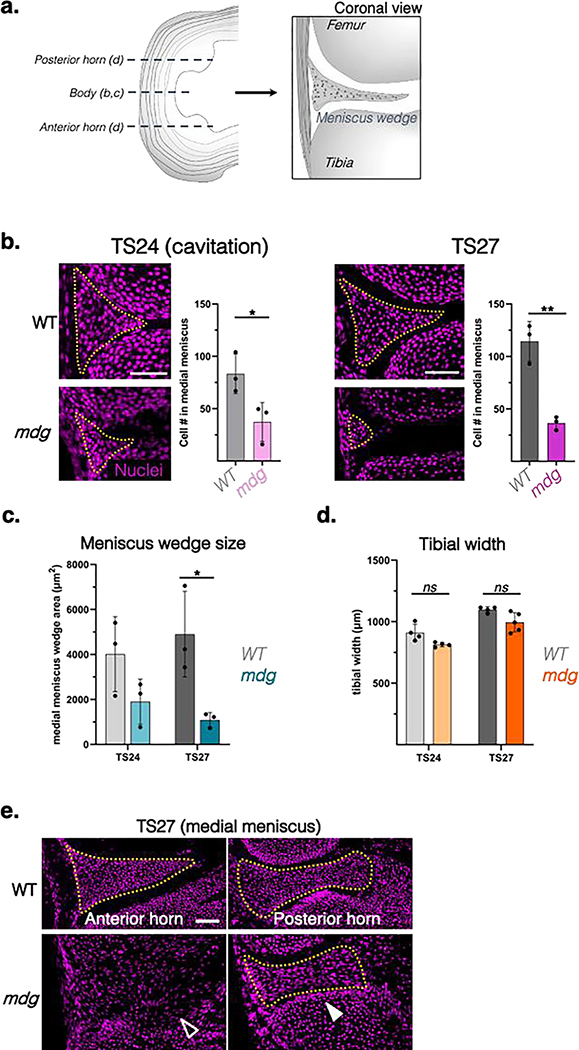
Figure 2: Alterations in meniscus morphogenesis in the absence of muscle contraction.
a) Schematic of the coronal (frontal) sections used to analyze the horn and body regions of the medial menisci in b-d. b) Representative nuclear (DAPI) stained coronal sections showing cell condensation in the meniscus body region of the developing knee at TS24 (knee joint cavitation timepoint corresponding to ~E15.5) and TS27 (~E17.5) in the muscular dysgenesis mouse (mdg) mouse model. Yellow dotted lines outline wedge-shaped cellular masses indicating meniscus formation in WT control and mdg mutant littermate joints (scale bar: 50μm). Adjacent plots show average cell number in condensates at respective timepoints. Mean and SEM shown (n=3 animals/group). Statistical comparison by two-tailed t-test. *: p<0.05; **: p<0.01; ***: p<0.001. c) Quantification of cross sectional area of the body region of the medial meniscus wedge as well as the cross-sectional width of the proximal tibial head (d) of WT and mdg mutant tissues at TS24 and TS27. Statistical comparison of tissues at each timepoint by two-tailed t-test (*: p<0.05, ns: not significant). e) Representative coronal sections of the anterior medial meniscus horn (left) and the posterior horn (right) of the same meniscus in WT and mdg TS27 (E17.5) knee joints labeled with a nuclear stain (magenta). Yellow outlines demarcate the meniscus wedge. Note the absence of a distinct wedge-shaped condensate in the anterior horn region (empty arrowhead) compared to the condensed posterior horn wedge (white arrowhead) in the mdg mutant (scale bar: 50μm).

