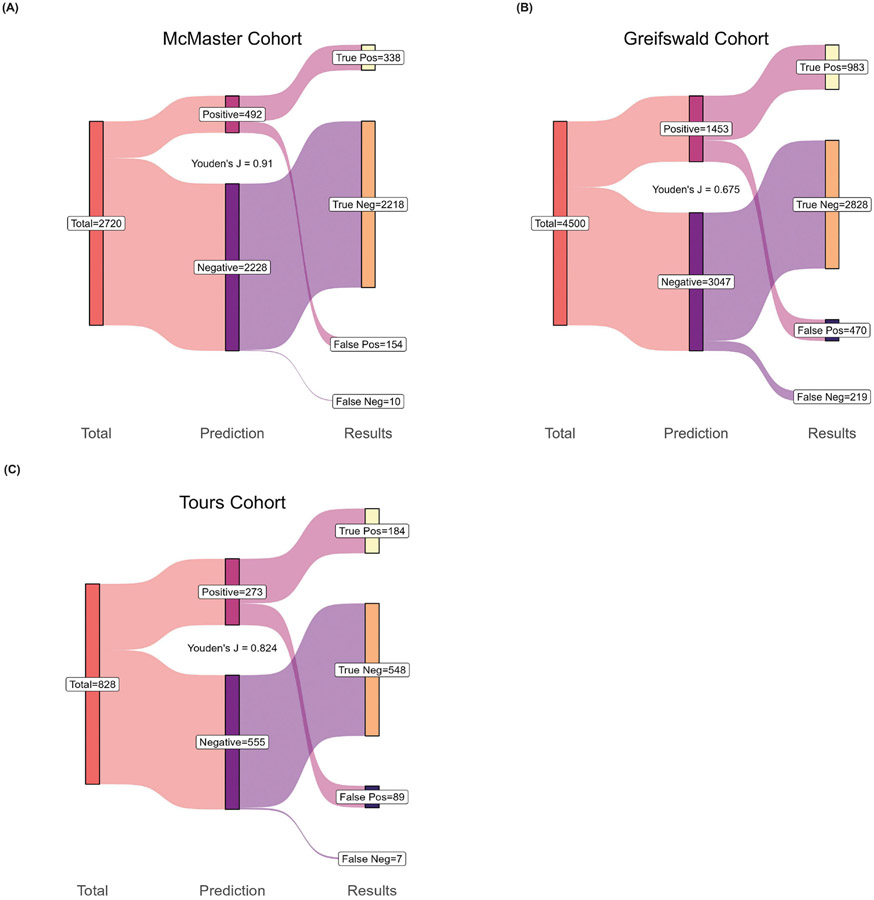
Figure 3:
Sankey diagram depicting the prediction for the final stepwise model in the A) McMaster cohort, B) Greifswald cohort, and C) Tours cohort. The performance of the cohorts’ model to discern true positive and negative functional assay individuals from false positive and negative patients are presented. Each diagram (starting from left) shows the number of individuals included in each cohorts’ model (individuals with missing data in any predictor variable were removed). The middle ‘Prediction’ column shows each models’ absolute count for the number of individuals predicted to be functional assay positive or negative. Listed in the right ‘Results’ column are the true functional assay positive patients, the number predicted to have a positive result but tested negative on functional assay (false positive), as well as those who are true negative and false negative (predicted to be functional assay negative but tested positive on function assay).

