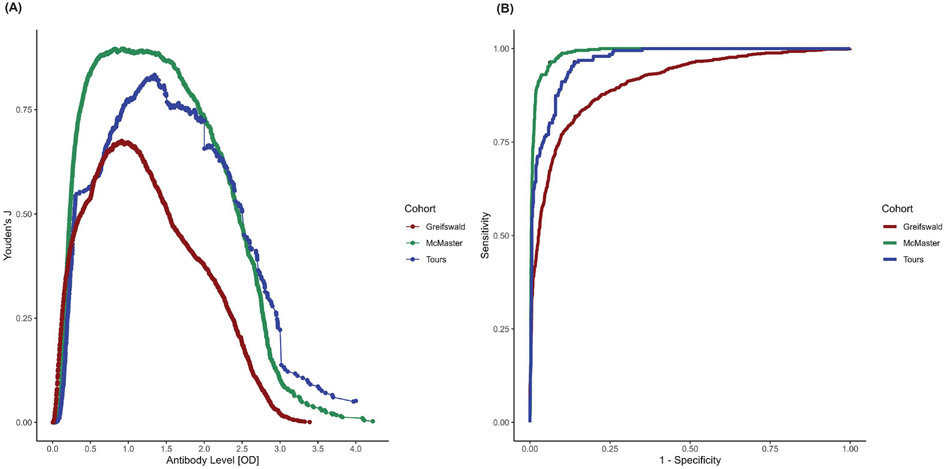
Figure 4:
A) Performance of anti-PF4/heparin antibody optical density units to predict functional assay positive status across three cohorts. Distribution of antibody OD units are plotted on the x-axis and on the y-axis the Youden’s index (J) value. The peak of each cohort’s plot indicates the antibody OD unit that best dichotomizes functional assay positive versus negative status. B) Area under the receiver operator characteristic (AUROC) curve showing the performance of the final stepwise model to accurately classify functional assay positive and negative individuals across all three cohorts. The legend on the right describes each cohort based on the line plot color with McMaster in green, Greifswald in red, and Tours in blue).

