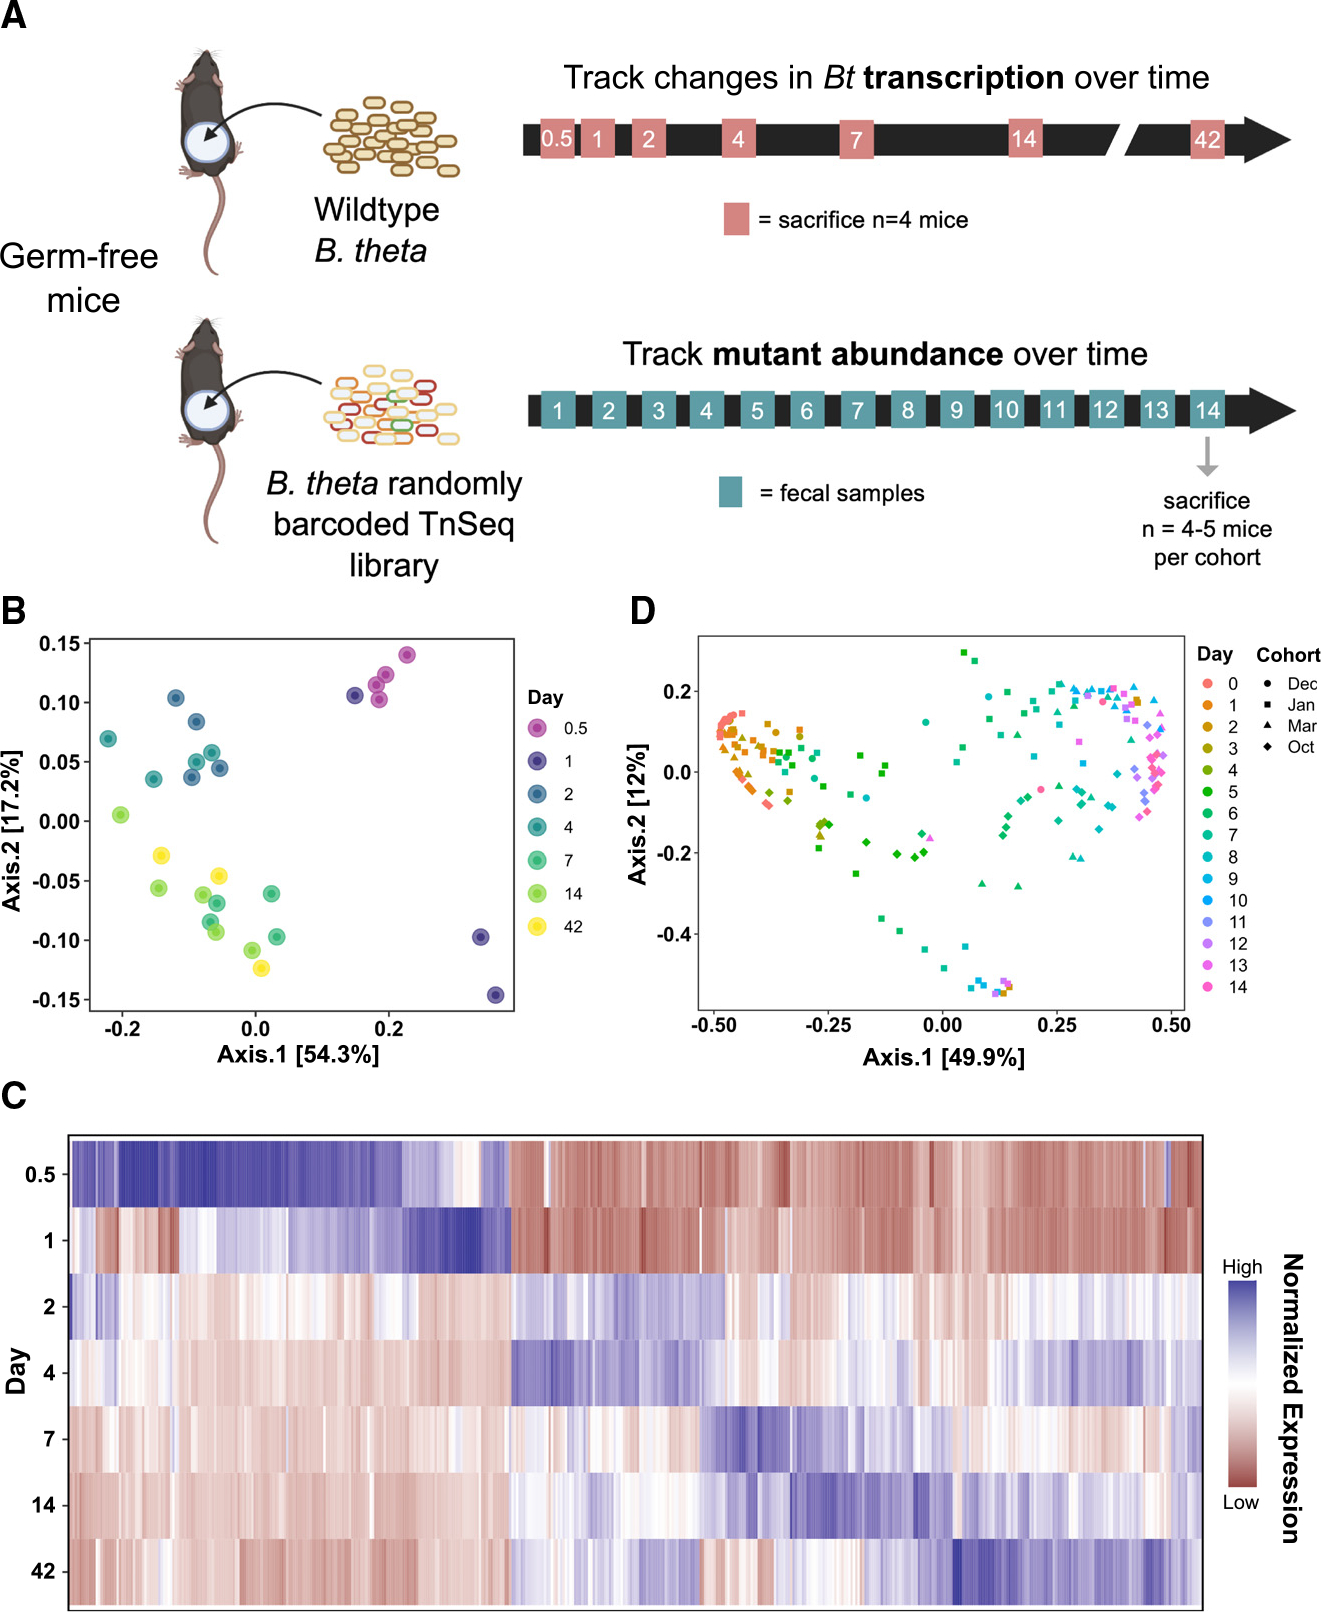
Figure 1. Bt gene expression and genetic fitness determinants shift over the course of colonization and persistence.

(A) Experimental scheme of transcriptomics (top) and functional genetics (bottom) experiments in germ-free (GF) mice.
(B) Principal coordinates analysis (PCoA) using Bray-Curtis dissimilarity on the global gene expression profile of WT Bt at 0.5, 1, 2, 4, 7, 14, and 42 days of colonization (n = 4–7 per group).
(C) Heatmap visualizing all genes that were significantly differentially expressed at any time point relative to day 1 (criteria: logFDR < −3, |log2FC| > 2, base mean >50 RPM). Each column represents an individual gene (Table S5); data are normalized across all time points for each gene.
(D) PCoA using Bray-Curtis dissimilarity on the abundances of RB-Tn mutant strains in fecal samples, colored by experimental day, shaped by experimental cohort. Four different cohorts of mice (n = 3–5 per cohort) are represented.
