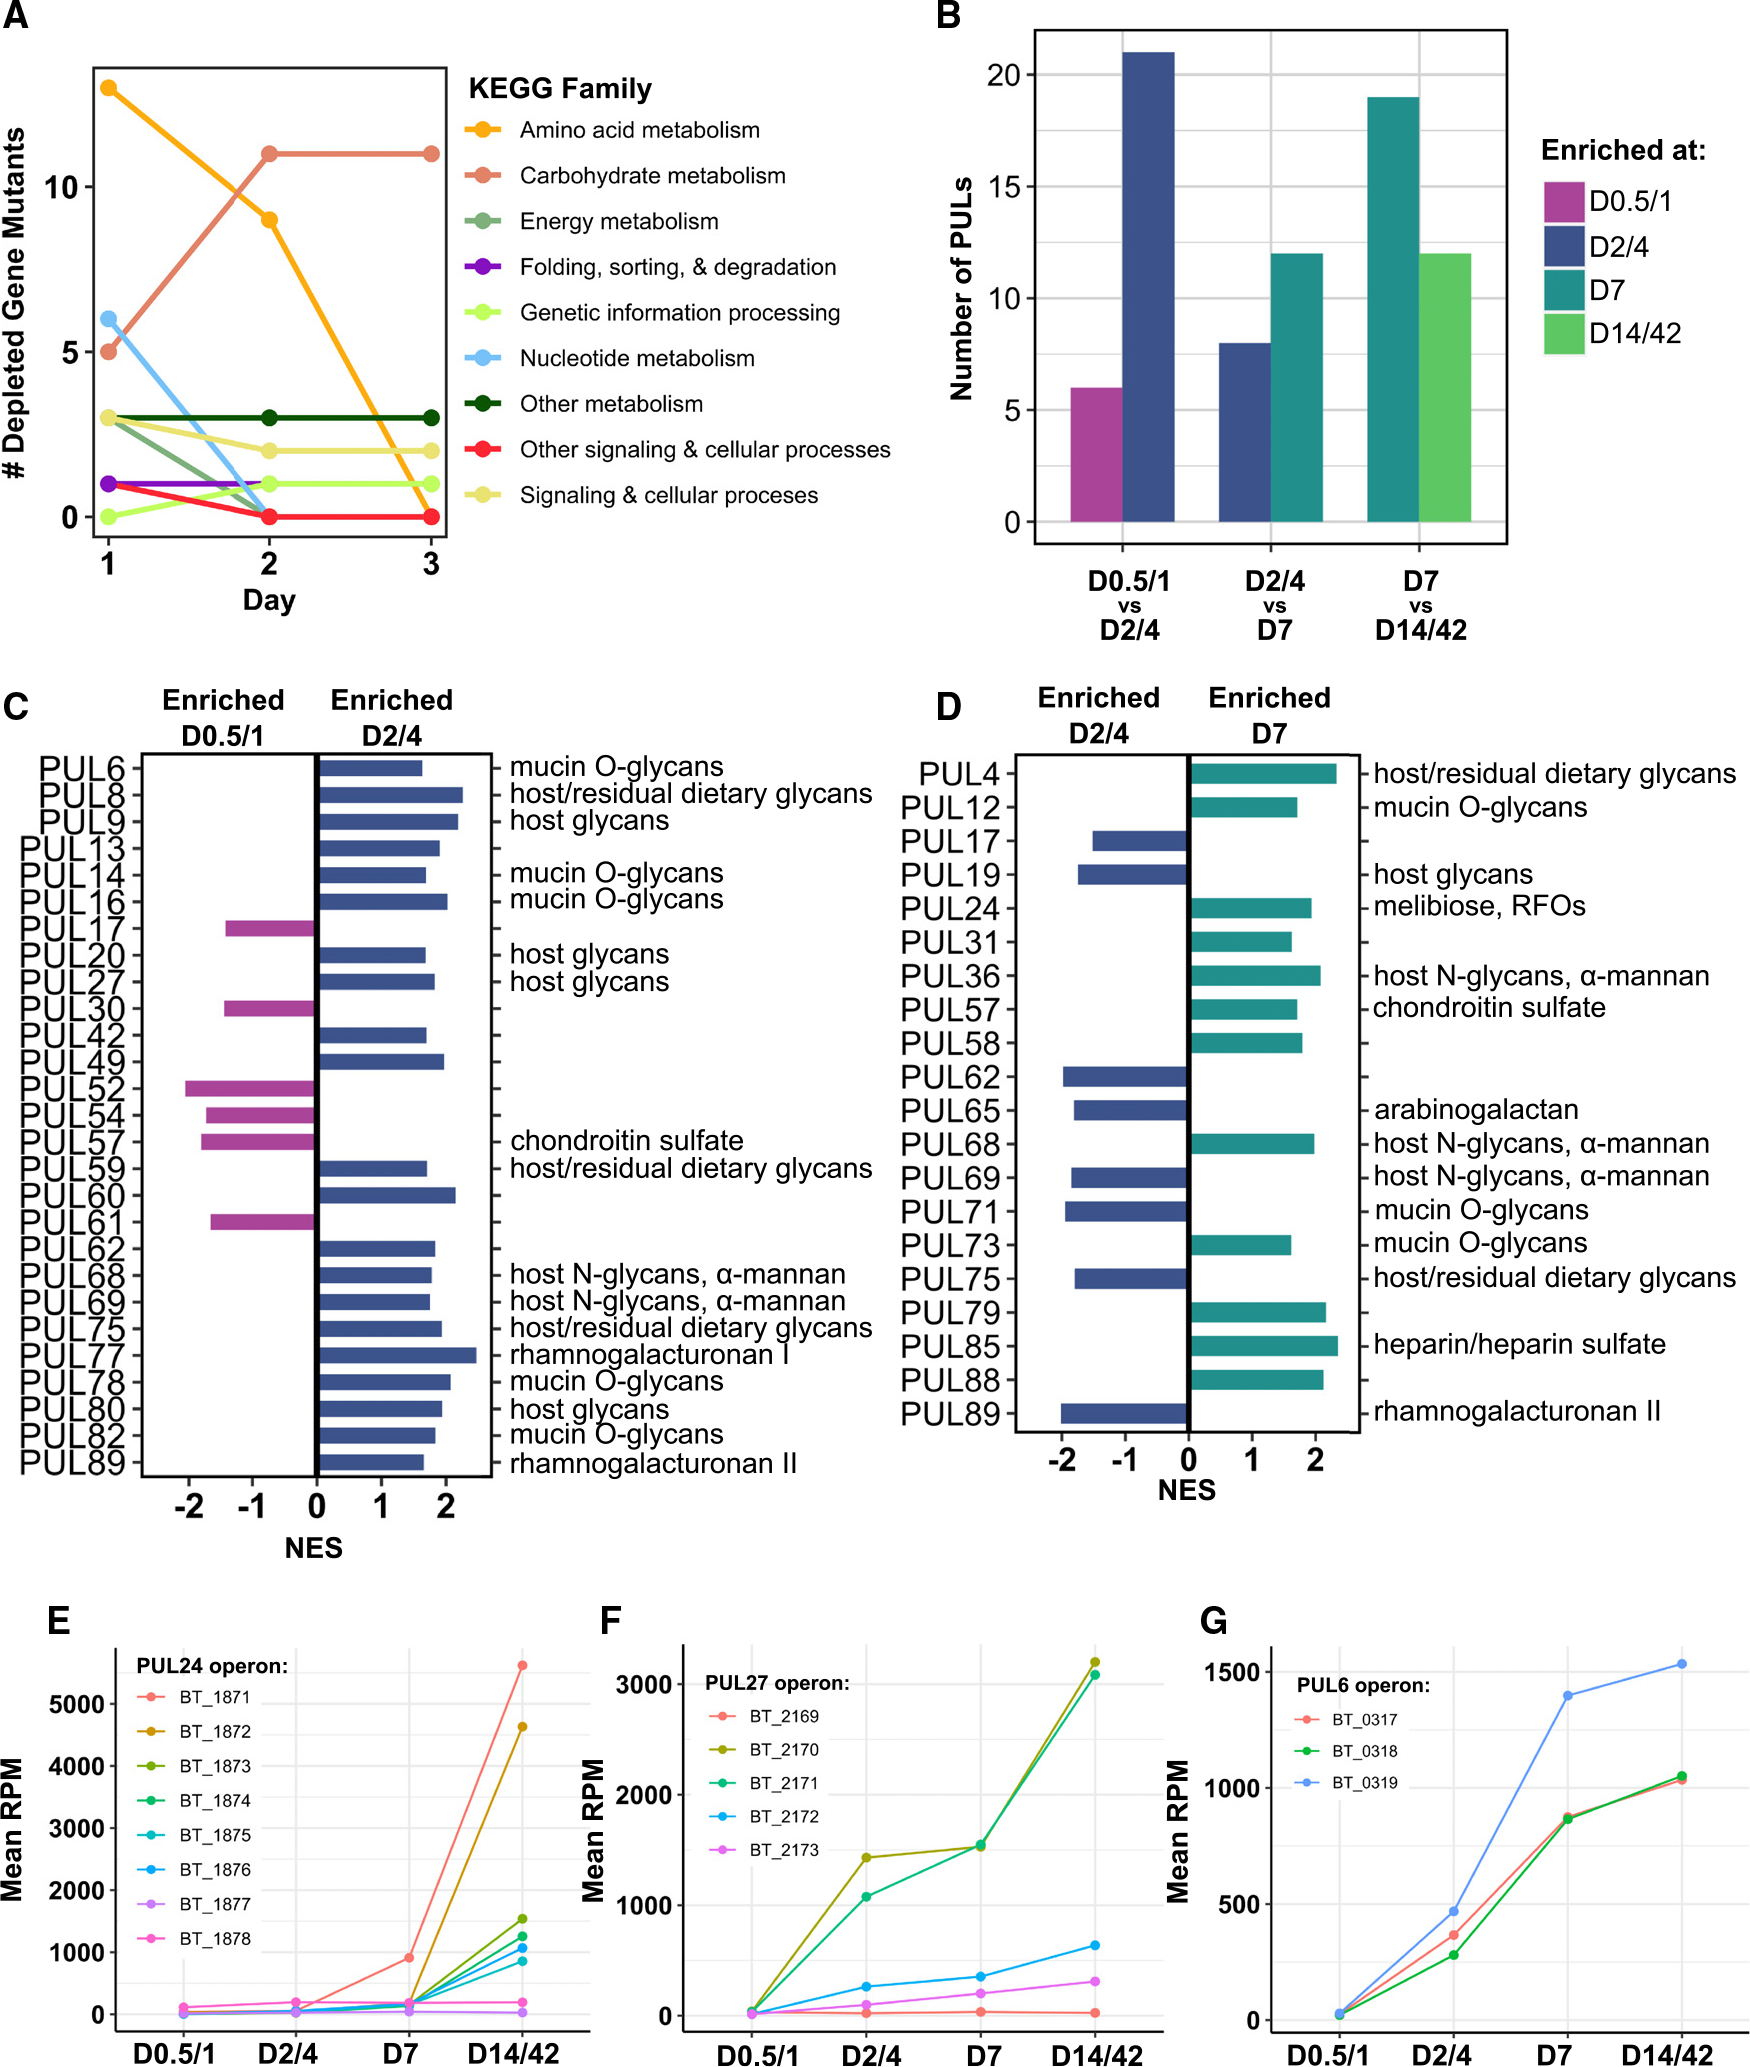
Figure 3. A shift toward greater expression of diverse sugar metabolism genes occurs during the first week of gut colonization.

(A) Number of gene mutants significantly depleted from day 1 to day 3 of the RB-Tn experiment (t statistic < −3σ), colored by KEGG family.
(B–G) Number of PULs significantly differentially expressed (adjusted p < 0.05) across sequential pairwise comparisons identified via GSEA using transcriptomics data. Specific PULs differentially expressed across (C) day 0.5 (D0.5)/D1 vs. D2/D4 and (D) D2/D4 vs. D7 identified via GSEA. Predicted PUL substrates are listed on the right. Mean expression levels (RPM) for all genes in the (E) PUL24, (F) PUL27, and (G) PUL6 operons. Error bars excluded for visual clarity; statistical comparisons done via GSEA.
See also Table S5.
