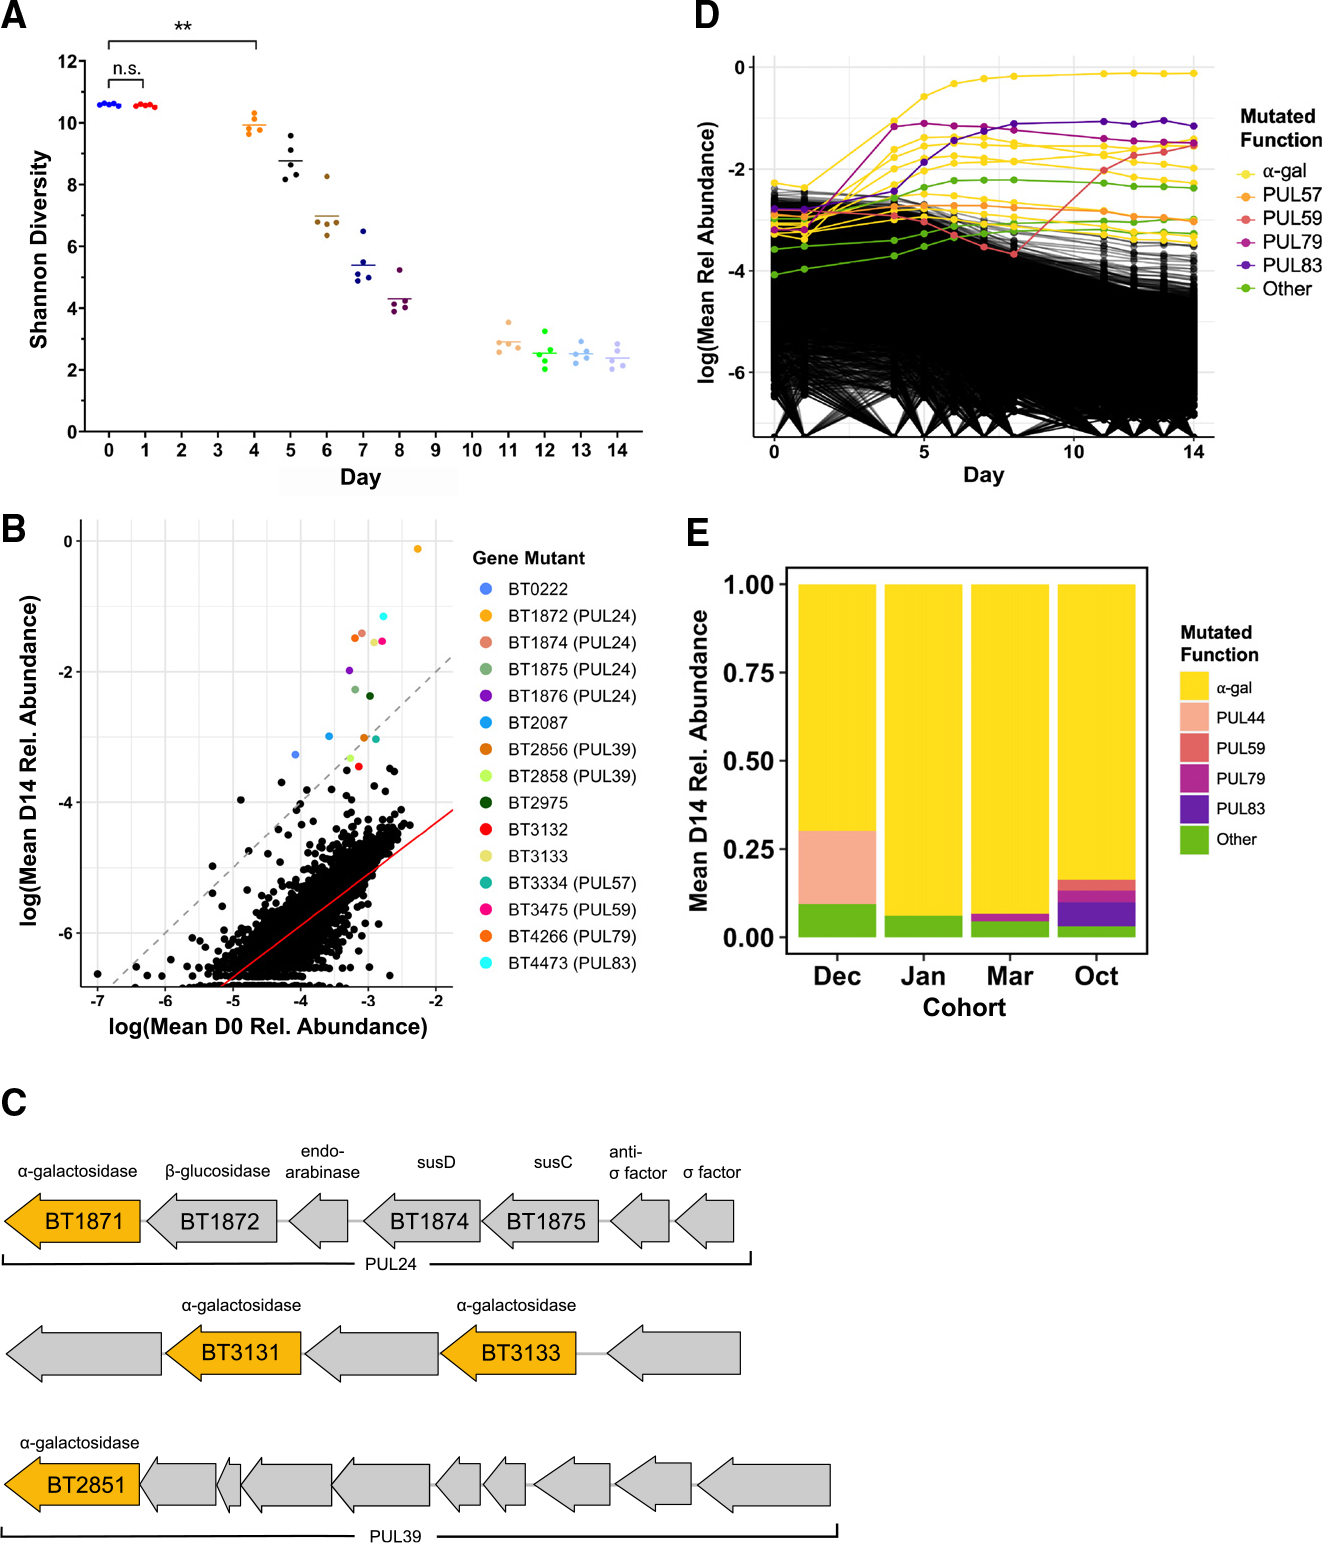
Figure 4. Colonization of a complex Bt mutant library within GF mice selects for disruptions upstream of α-galactosidase genes.

A–D) (A, B, and D) Data from a single experimental run (October). (A) Shannon diversity of the RB-Tn mutant pool in mice over time. Each point represents the RB-Tn pool within a single mouse on the indicated day (**p < 0.01, t test, n = 5/time point). (B) Initial (inoculum, day 0) vs. final (day 14) relative abundance of RB-Tn mutant strains. Each point represents the summed relative abundance of all mutant strains that mapped to given gene, averaged across mice. Dashed gray line designates a 1:1 relationship between starting and final abundance; red line represents a linear regression best-fit line generated from the log-transformed data (p < 2e−16, R2 = 0.6461; STAR Methods). (C) Organization of PUL 24 (BT1871–1877), an unnamed PUL containing BT3130–3134, and PUL 39 (BT2851–2860). Predicted α-galactosidases are colored yellow. (D) Relative abundance of RB-Tn mutant strains over time. Each line represents the summed relative abundance of all mutant strains that mapped to a given gene, averaged across mice. Top 15 most abundant gene mutants at day 14 are colored by the PUL to which they mapped; all others are black.
(E) Day-14 relative abundance of gene mutants mapping to operons that encode α-galactosidase functions (yellow), known PULs, or other gene functions averaged across mice for each experimental run.
