. 2021 Oct 29;65(5):537–548. doi: 10.20945/2359-3997000000400

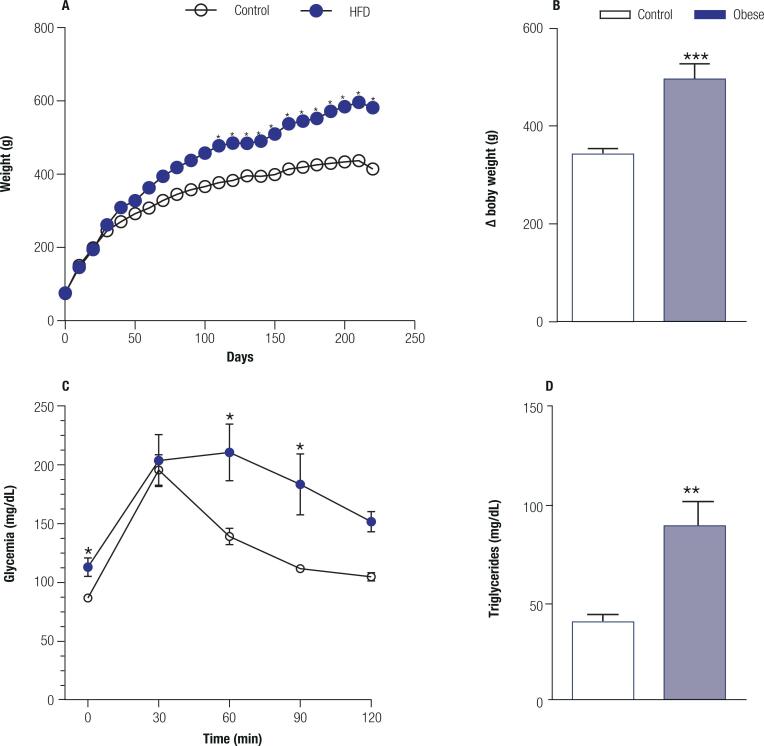
Figure 2. High-fat diet induces metabolic syndrome. A. Body weight chart over the 8 months period of treatment with a high-fat diet (40%) in the obese group (n = 10) and a standard diet in the control group (n = 10). B. Delta values for body weight over the 8 months of treatment with a high-fat diet (40%) in the obese group and a standard diet in the control group (p = 0.0003). C. Glucose tolerance test at the end of the 8 months treatment (p = 0.041) with a high-fat diet (40%) in the obese group and a standard diet in the control group. D. Plasma triglycerides at the end of the 8 months treatment with a high-fat diet (40%) in the obese group and standard diet in the control group (p = 0.0045). Values are the mean ± SEM. * p < 0.01 compared with control animals.

Figure 2