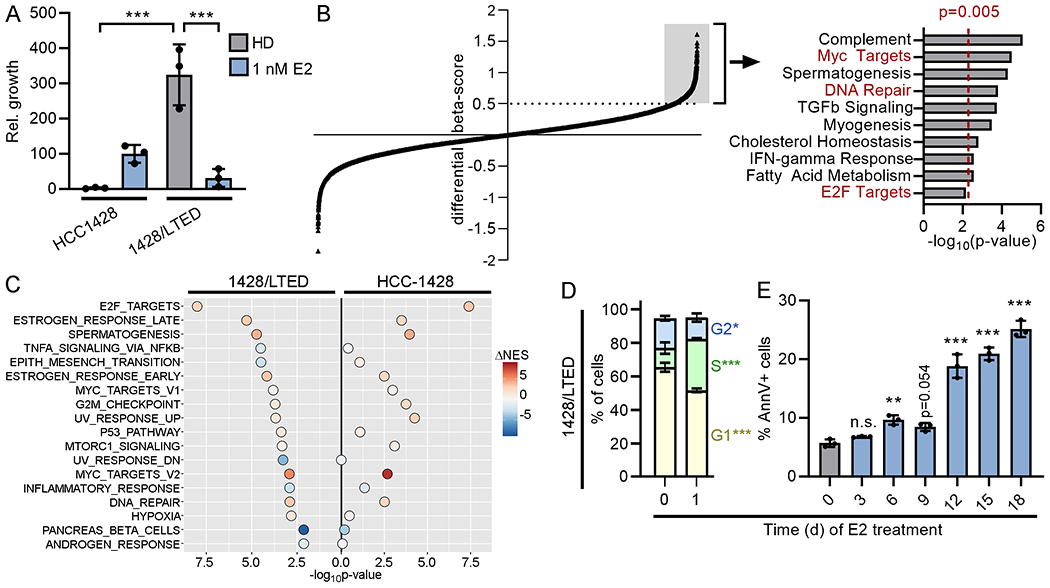
Figure 1. 17β-estradiol induces DNA damage in long-term estrogen-deprived cells that therapeutically respond to E2.

(A) Parental cells were HD for 3 d prior to seeding. Cells were treated as indicated for 4 wk and relative growth was measured. (B) 1428/LTED cells stably expressing Cas9 were transduced with a sgRNA library. Cells were treated ± 1 nM E2 for 3 wk, and beta-scores were calculated (18). Each point represents one gene. Genes with a differential beta-score ≥0.5 (n=1194, gray box) were analyzed for enrichment with Hallmarks gene sets (right). Cell cycle and DNA repair pathways are highlighted in red font. (C) HCC-1428 (HD for 3 d) and 1428/LTED cells were treated ± 1 nM E2 for 24 h, and RNA was harvested for sequencing. Single-sample gene set enrichment analysis (ssGSEA) for Hallmarks pathways was performed for each replicate sample, and normalized gene set enrichment scores (NES) were compared between treatment groups. Gene sets significantly (p<0.05) altered in 1428/LTED cells by E2 treatment are shown, and p-values and differences in mean NES induced by E2 treatment are indicated for each cell line. (D) Cells treated ± 1 nM E2 x 24 h were fixed and stained with propidium iodide (PI). DNA content was measured by flow cytometry. Sub-G1 cells were excluded from plots. Proportions of cells in each phase were compared. (E) Cells were treated ± 1 nM E2 as indicated. Three days after last medium change, cells were harvested, stained with FITC-tagged Annexin V (AnnV), and analyzed by flow cytometry. In (A/D/E), data are shown as mean of triplicates ± SD. *p<0.05, **p<0.005, ***p<0.0005, n.s. = not significant compared to control unless otherwise indicated.
