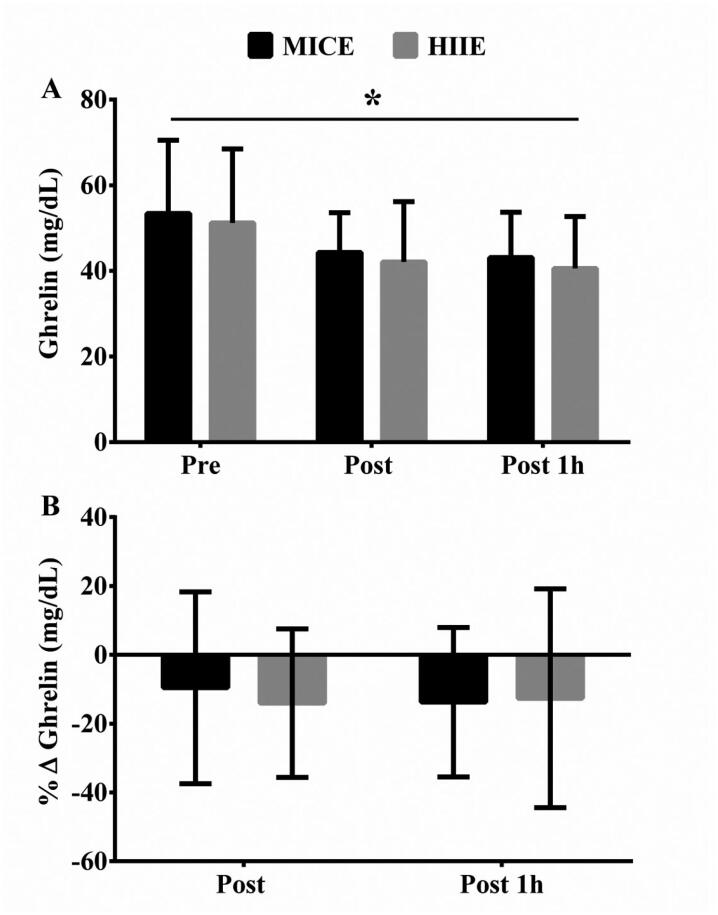
Figure 1. Ghrelin levels pre-exercise, immediately post-exercise and 1h post-exercise sessions.
HIIE: high-intensity interval exercise; MICE: moderate-intensity continuous exercise.
Panel A shows the absolute values of ghrelin levels.
Panel B shows the delta of change (post – pre-exercise values) of ghrelin levels.
Data are reported as means ± standard deviation.
*Main effect of time for both exercise sessions (p < 0.05).

