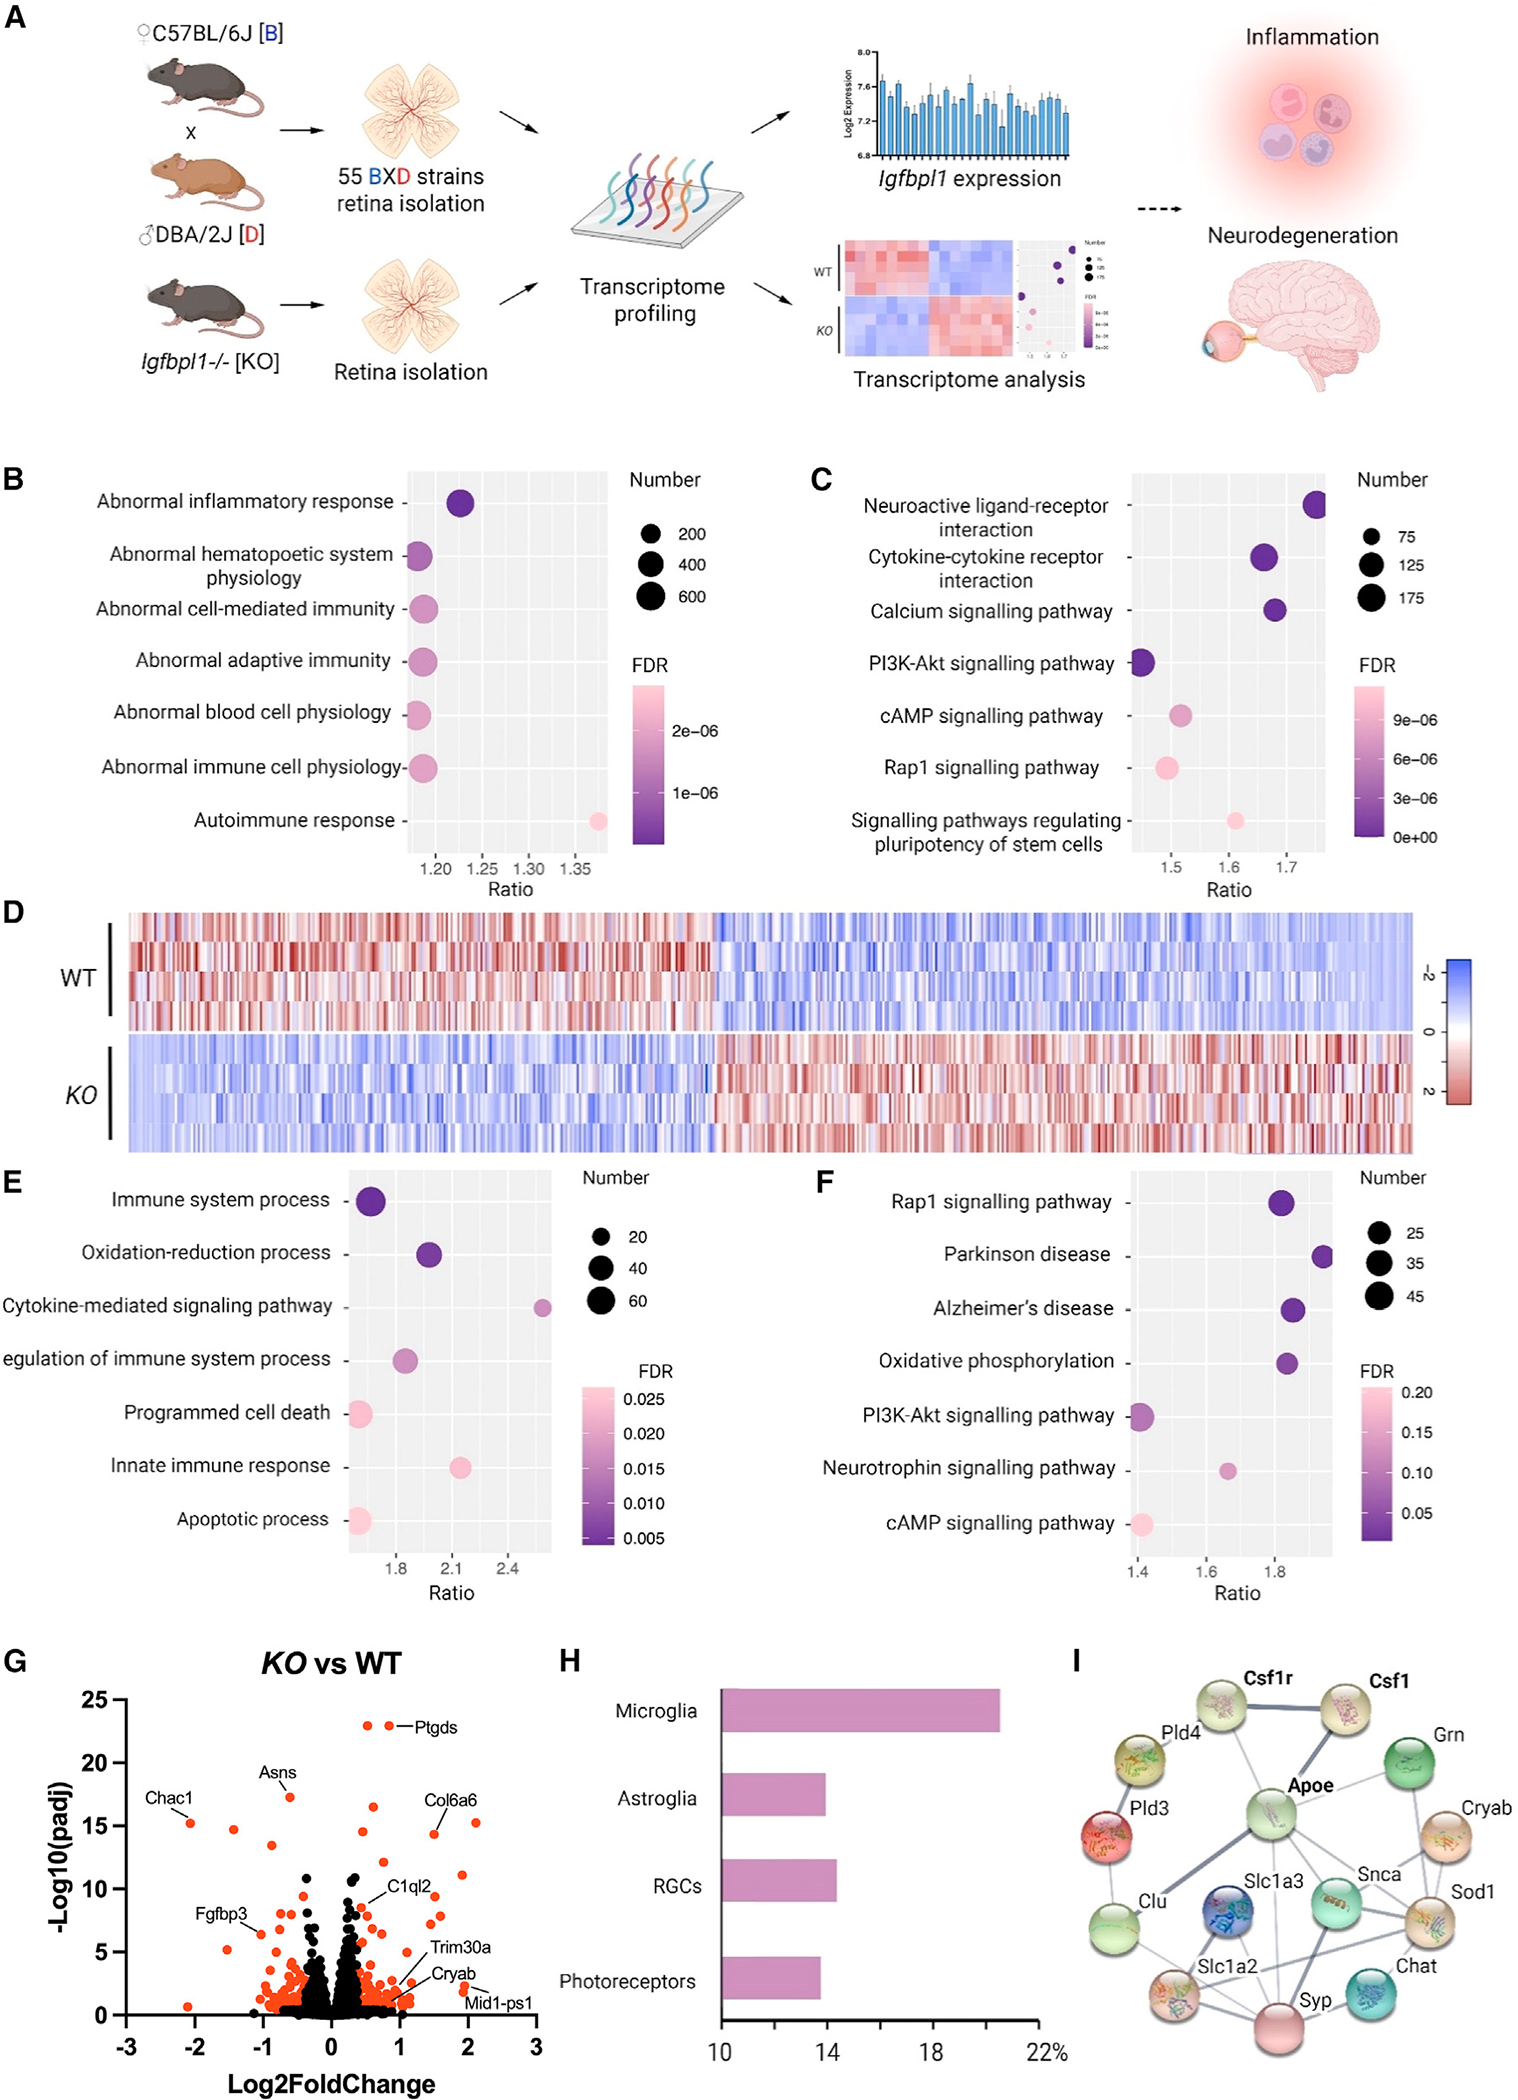
Figure 1. Systems genetics approach identifies IGFBPL1 as an immune and microglial regulator in the mouse retina.

(A) Schematic of the reverse genetics approach that predicts the functions of Igfbpl1 based on genome-wide transcriptome profiles of BXD and KO mouse retinas.
(B and C) Dot plots of top 7 most significant MPO (B) and enriched KEGG (C) terms and projected based on expression covaried with IGFBPL1 in the BXD mouse retinas.
(D) Heatmap of DEGs between KO and WT mouse retinas.
(E and F) Dotplots of top 7 most relevant MPO (E) and enriched KEGG (F) terms projected using DEGs of KO mice compared with WT mice.
(G) Volcano plot showing DEGs of KO mice compared with WT mice. Red dots: FDR <0.05 and fold change (FC) >1.3.
(H) Percentages of DEGs clustered to cell-type-specific genes.
(I) Protein-protein interaction network of top 14 microglial associated DEGs visualized in String.
See also Figure S1.
