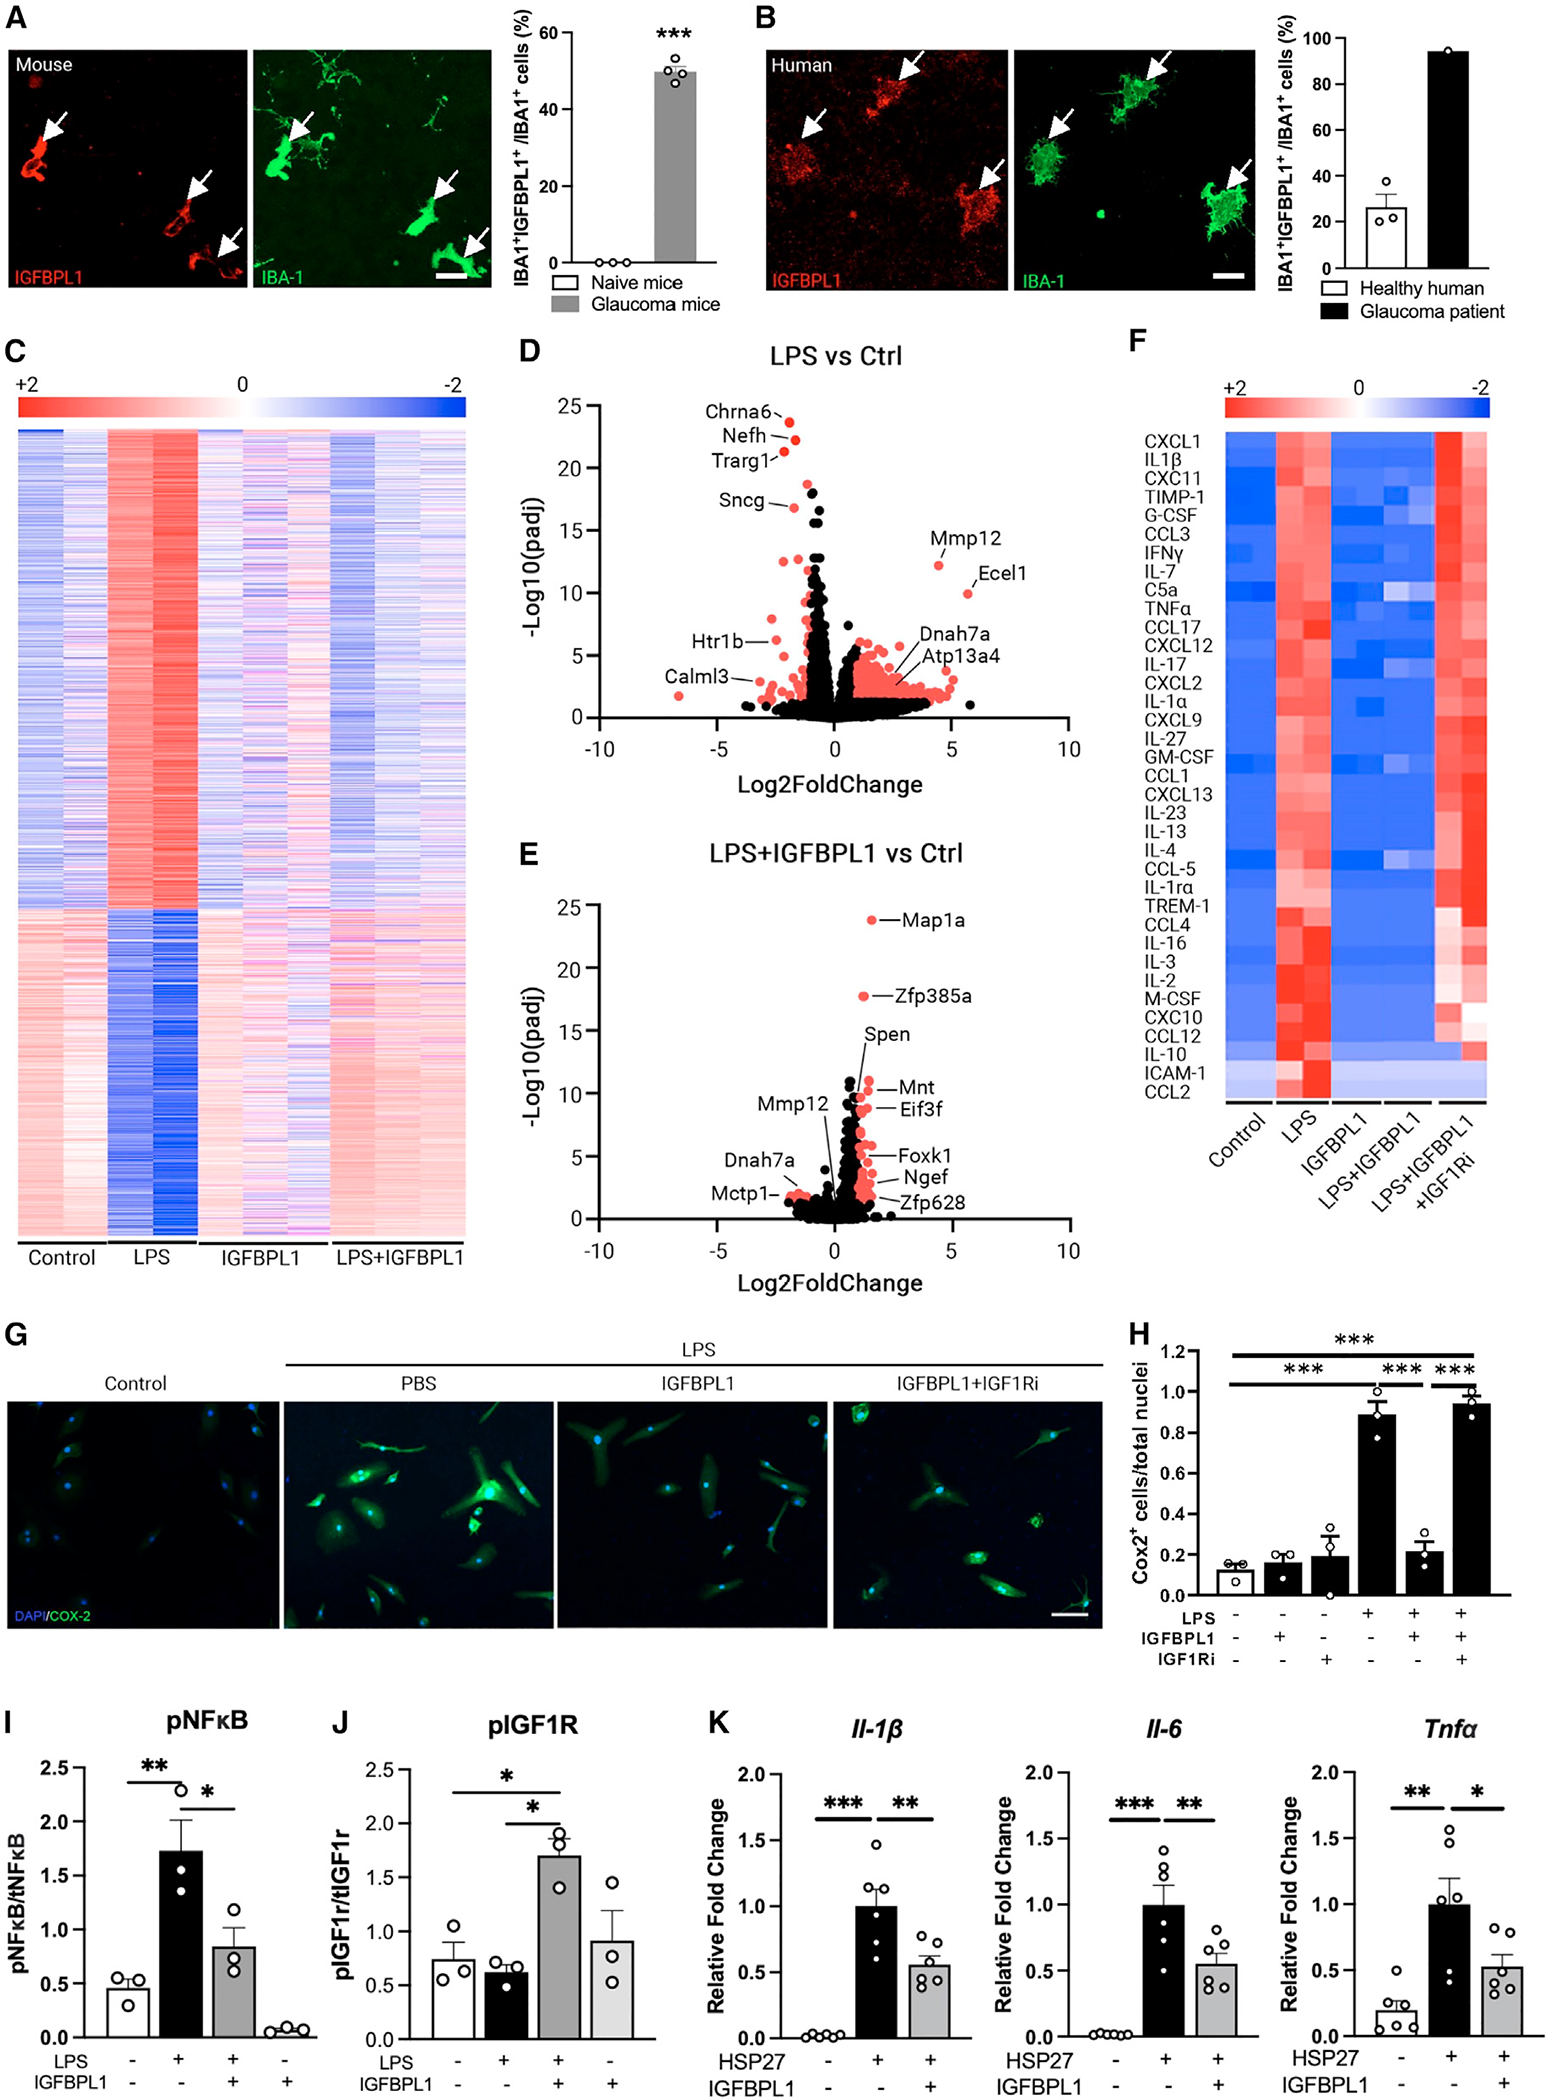
Figure 2. IGFBPL1 resets the transcriptional signature of inflammatory microglia to a homeostatic state.

(A and B) Photomicrographs of mouse (A) and human (B) retinal flat mounts double immunolabeled for IGFBPL1 (red) and IBA-1 (green) and percentage of IGFBPL1-expressing microglia. Arrows indicate IGFBPL1+/IBA-1+ cells. Scale bar, 20 μm. ***p < 0.001; Student’s t test. n = 3–4 mice/group, 3 healthy donors and 1 glaucoma donor.
(C) Heatmap of DEGs of cultured retinal microglia treated with control, LPS, IGFBPL1, and LPS+IGFBPL1.
(D and E) Volcano plot showing DEGs of microglia treated with LPS (D) or LPS+IGFBPL1 vs. control (E). Red dots represent DEGs with padj <0.05 and |log2[FC]|>1.
(F) Heatmap of cytokine levels in microglial cultures treated with control (control), LPS, IGFBPL1, LPS+IGFBPL1, and LPS+IGFBPL1+IGF1Ri assessed by cytokine arrays.
(G and H) Images (G) and COX2+ cell counts (H) in microglial cultures treated with control or LPS and PBS, IGFBPL1, or IGFBPL1+IGF1Ri. Cultures were counterstained with DAPI. Scale bar, 20 μm. ***p < 0.001; one-way ANOVA with Dunnett’s multiple comparisons test. n = 3/group. Data are mean ± SEM.
(I and J) Quantifications of pNF-κB (I) and pIGF1R (J) in mouse microglial cultures treated with PBS, LPS, IGFBPL1, or LPS+IGFBPL1. *p < 0.05, **p < 0.01; one-way ANOVA with Dunnett’s multiple comparisons test. n = 3/group.
(K) Relative mRNA levels of pro-inflammatory cytokines in HSP27-primed microglial cultures treated with or without IGFBPL1. *p < 0.05, **p < 0.01, ***p < 0.001; one-way ANOVA with Dunnett’s multiple comparisons test. n = 6 replicates/group. Data are mean ± SEM.
See also Figure S2.
