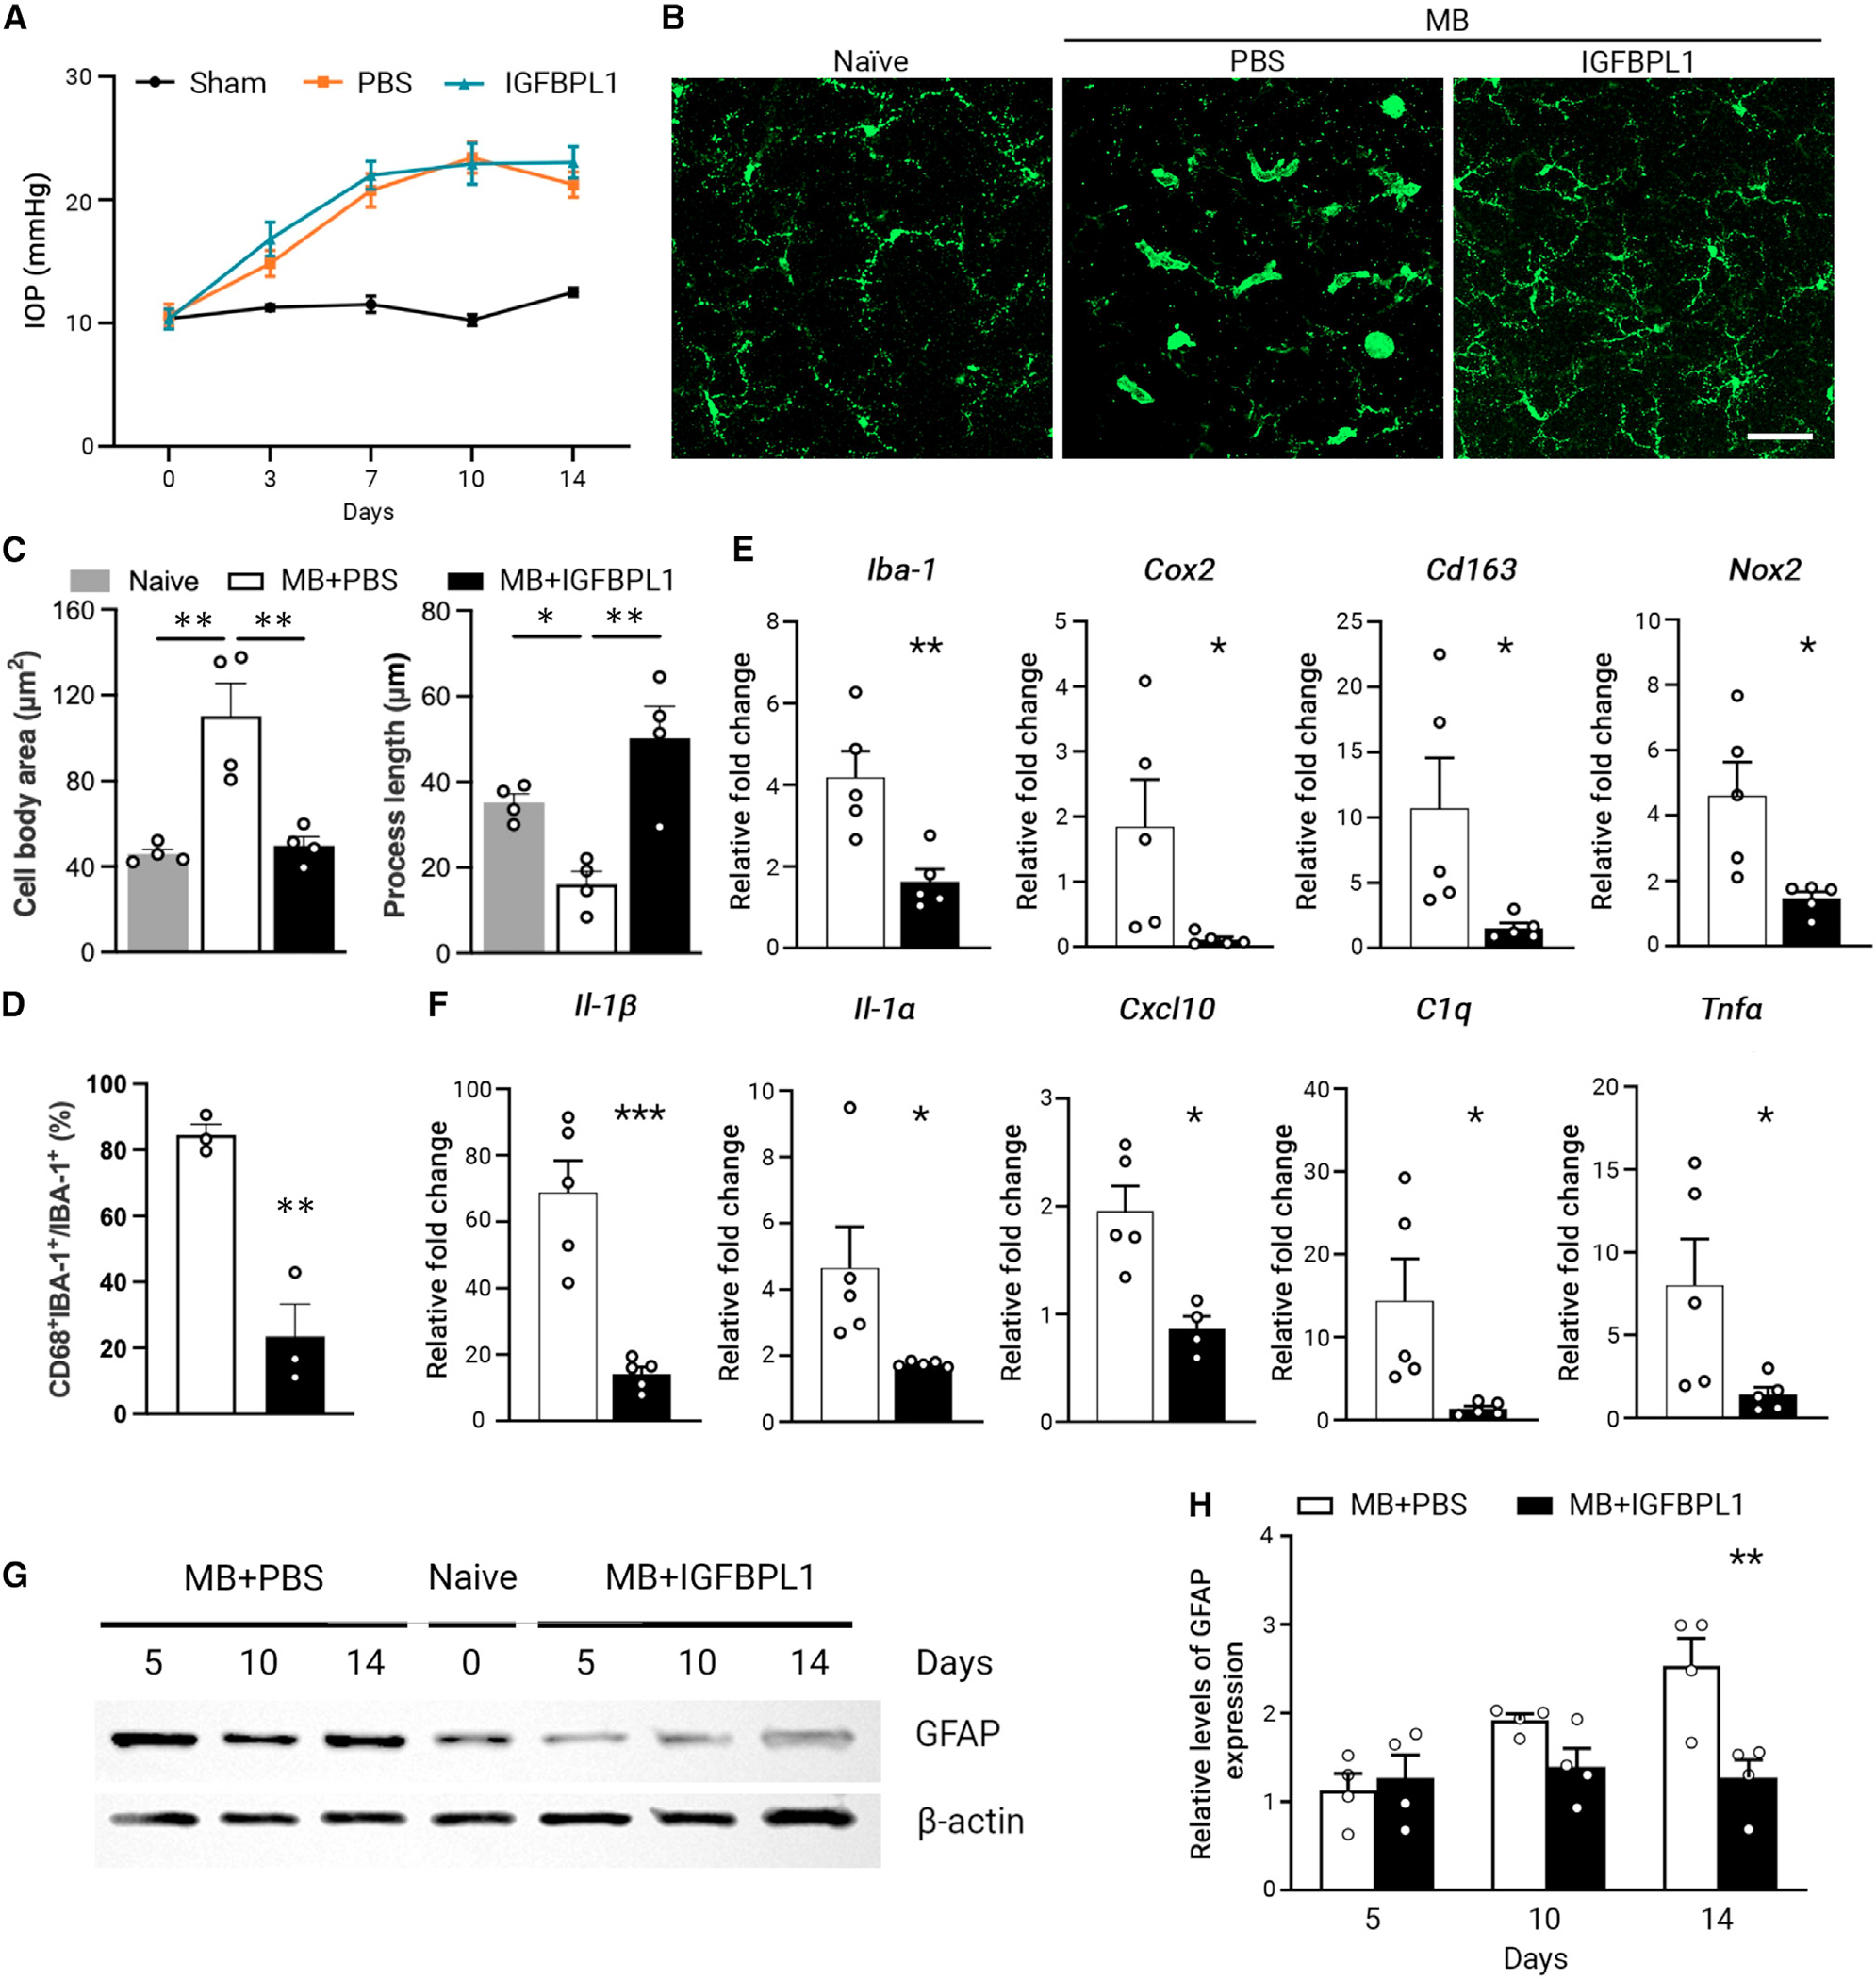
Figure 3. IGFBPL1 suppresses retinal microglial activation in mice with glaucoma.

(A) IOP profiles in sham-operated (sham) and MB-injected mice injected with PBS or IGFBPL1. n = 10 mice/group.
(B) Images of IBA-1+ cells in retinal flat mounts of naive or MB-injected mice that received PBS or IGFBPL1 treatment. Scale bar, 50 μm.
(C) Quantification of microglial cell body area and process length in retinal flat mounts of MB-injected mice that received PBS or IGFBPL1 treatment. **p < 0.01; Student’s t test. n = 4 mice/group.
(D) Percentage of CD68+ microglia in retinal flat mounts of MB-injected mice that received PBS or IGFBPL1 treatment. **p < 0.01; Student’s t test. n = 3 mice/group.
(E and F) Relative mRNA levels of activated microglia markers (E) and pro-inflammatory cytokines (F) in PBS- or IGFBPL1-treated retinas normalized to that of naive mice. *p < 0.05, **p < 0.01, ***p < 0.001; Student’s t test. n = 5 mice/group.
(G and H) Western blot image (G) and quantification (H) of GFAP levels in retinal flat mounts of PBS- or IGFBPL1-treated mice after MB injection. GFAP expression was normalized to the corresponding β-actin intensity and presented relative to that of naive mouse retinas. **p < 0.01; two-way ANOVA with Šídák multiple comparisons test. n = 4 mice/group.
Data are mean ± SEM.
See also Figure S2.
