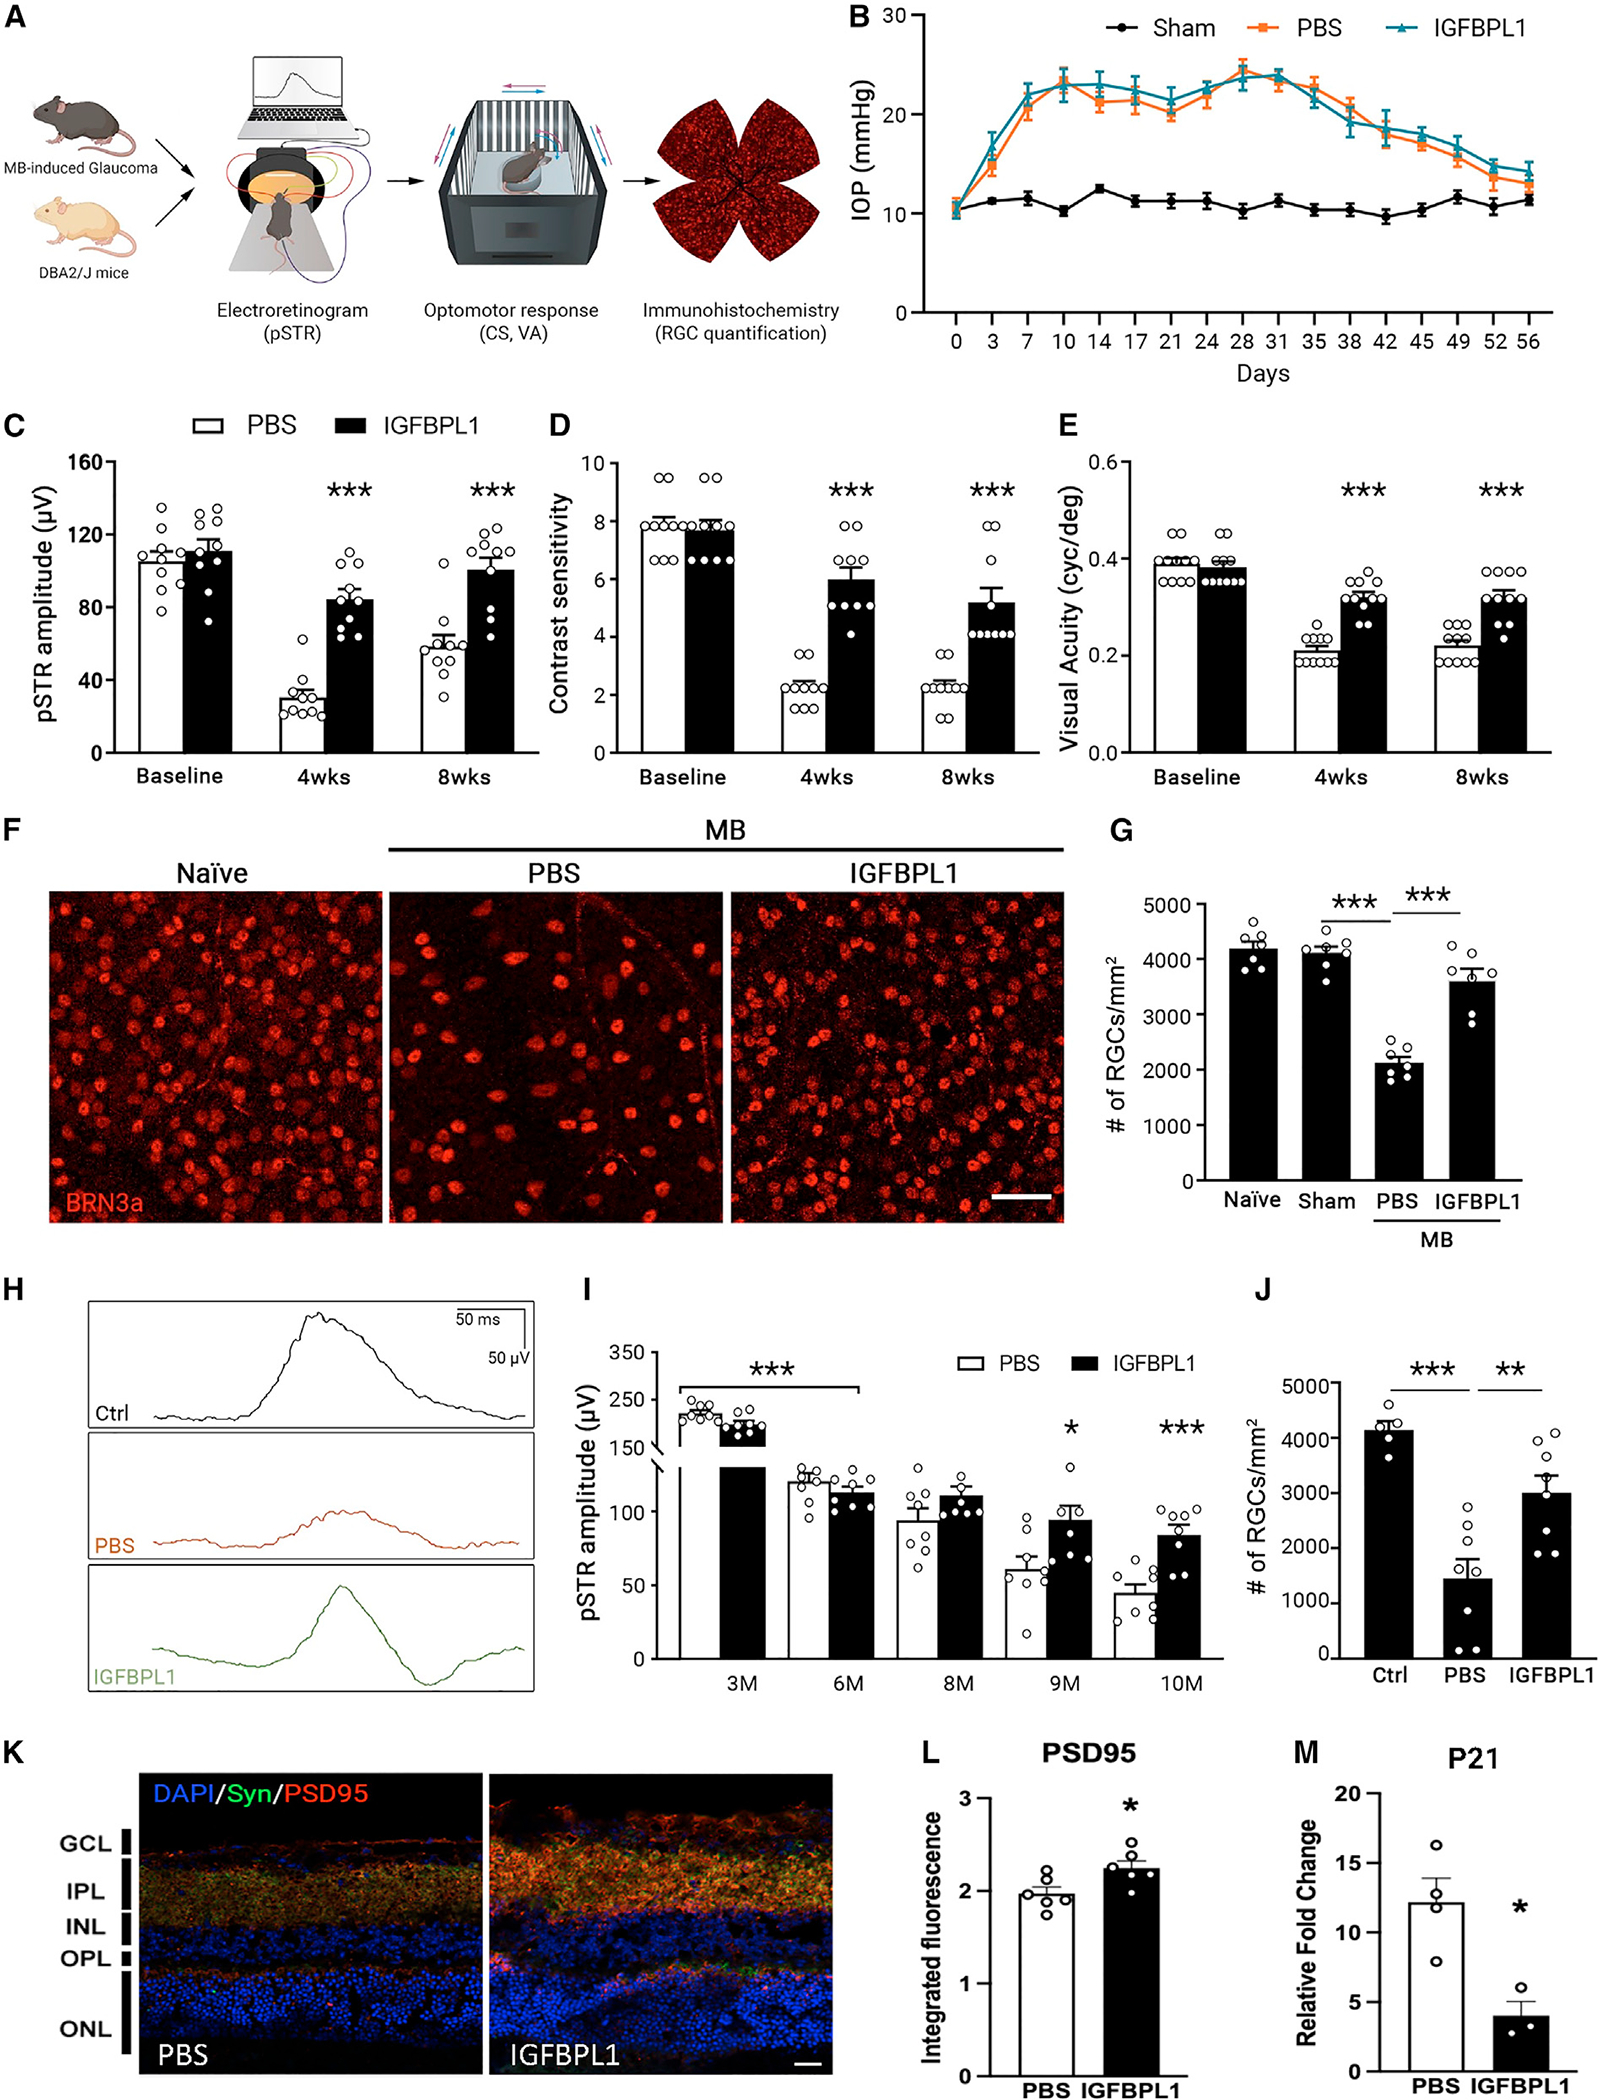
Figure 6. IGFBPL1 rescues RGCs and visual function in glaucomatous mice.

(A) Illustration of electroretinogram (ERG), optomotor response (OMR), and morphological assessments in MB-injected C57BL/6J or DBA/2J mice.
(B) IOP profiles of shamor MB-injected mice that received PBS or IGFBPL1 treatments. n = 10 mice/group.
(C–E) pSTR amplitudes (C) and values of CS (D) and VA (E) in MB-injected mice that received PBS or IGFBPL1 treatment. ***p < 0.001; two-way ANOVA with Šídák multiple comparisons test. n = 10 mice/group.
(F and G) Images (F) and counts (G) of BRN3a+ cells in retinal flat mounts of naive and sham- and MB-induced mice that received PBS or IGFBPL treatment. Scale bar, 50 μm. n = 7 mice/group.
(H) Representative pSTR waveforms in untreated 6- (control [Ctrl]) and 10-month-old DBA/2J mice that received monthly injections of PBS or IGFBPL1.
(I) pSTR amplitudes in DBA/2J mice. Mice that received a monthly injection of PBS or IGFBPL1 at 7–9 months old were sacrificed at 10 months old. *p < 0.05, ***p < 0.001; two-way ANOVA with Šídák multiple comparisons test. n = 8 mice/group.
(J) RGC counts in untreated 6- (Ctrl) and 10-month-old DBA/2J mice that received monthly treatments of PBS or IGFBPL1 at 7–9 months of age. **p < 0.01, ***p < 0.001; one-way ANOVA with Tukey’s multiple comparisons test. n = 8 mice/group.
(K) Image (K) of PSD95 (red) and synaptophysin (Syn; green) immunolabeling in retinas of 15-month-old WT mice that received PBS or IGFBPL1 injections. Scale bar, 15 μm.
(L and M) Quantification of PSD95 immunofluorescence intensity (L) and quantitative real-time PCR of p21 (M) in PBS- and IGFBPL1-treated groups. n = 3–6 mice/ group. *p < 0.05; Student’s t test.
Data are mean ± SEM.
See also Figure S7.
