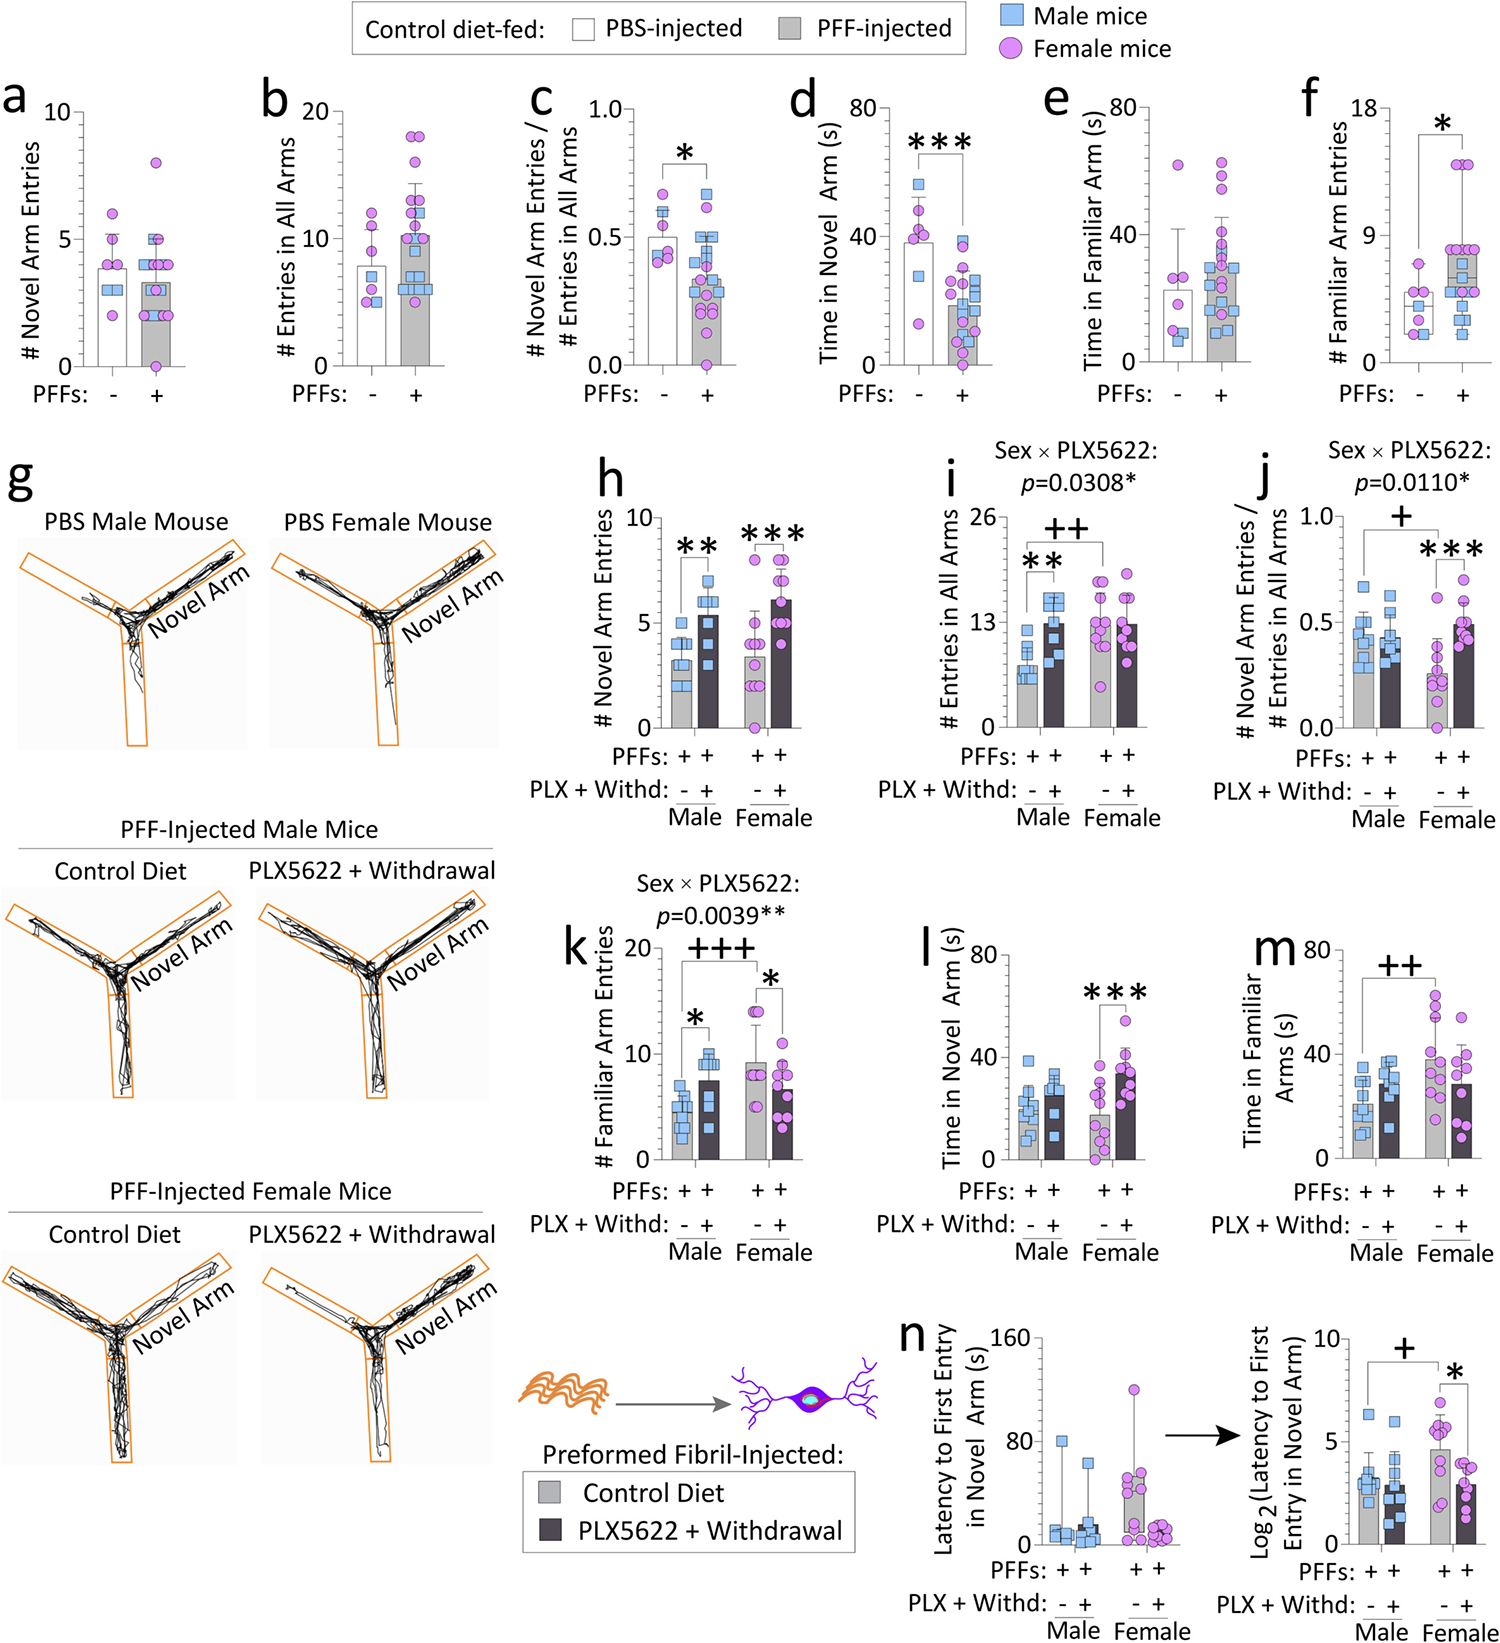
Fig. 2. Transient exposure to PLX5622 (2-weeks “ON” and 7-weeks “OFF”) improves spatial reference memory in preformed fibril-injected aged female mice.

Aged, outbred CD-1 mice of both sexes were fed special chow with or without the CSF1R inhibitor, PLX5622, for two weeks, and then fed standard rodent chow for an additional 7 weeks (timeline in Fig. 1a). Preformed fibrils (PFFs; 5 μg in 1 μL) were injected into the bulbar anterior olfactory nucleus seven days after initiation of the PLX5622 diet. PFF-injected mice were tested on a Y-maze for spatial reference memory after PLX5622 was withdrawn from the diet (timeline in Fig. 1a). PBS-injected aged mice from each sex (total n = 7 across both sexes; remaining n = 2 PBS-infused aged mice had to be euthanized early due to sickness, see Methods) were included as controls to determine if PFF-infusions per se elicit loss of spatial reference memory (a-f). Numbers of novel arm entries are shown, expressed alone or as a fraction of total number of entries in all arms (a-c), to control for differences in activity. Time spent exploring the novel and familiar arms (d-e) and numbers of familiar arm entries (f) are shown, for the PBS versus PFF-infused aged mice. For control or transient PLX5622-diet fed, PFF-injected aged mice, numbers of novel arm entries (expressed alone in h or as a fraction of total number of entries in all arms in i-j), numbers of familiar arm entries (k), time spent exploring the novel arm (l), time spent exploring the familiar arms (m), and latencies to first entry in the novel arm (n) are shown. In g are representative ANY-maze trackplots. Out of the n = 40 PFF-infused mice, two mice were sacrificed early due to dermatitis and an abdominal abscess and were excluded from the Y-maze test (see Methods). Mice that made less than three arm entries during the first minute of the second Y-maze trial were also excluded (see SI Methods and (Wolf et al., 2016)). Data in n were non-Gaussian per the Shapiro-Wilk test and log-transformed (arrow) to assess statistical interactions between the two independent variables. Intervariable statistical interactions are shown above respective graphs. Each mouse is illustrated as a colored dot on bar graphs with group means + SDs or on box plots with interquartile ranges. *p ≤ 0.0500, ***p ≤ 0.0010 for PBS vs. PFFs; Mann-Whitney U (boxplot in f) or the unpaired t-test (a-e). *p ≤ 0.0500, **p ≤ 0.0100, ***p ≤ 0.0010 for control diet vs. transient dietary PLX5622; +p ≤ 0.0500, ++p ≤ 0.0100, +++p ≤ 0.0010 for male vs. female; Kruskal-Wallis (left panel of n) or two-way ANOVA/Bonferroni for h-m and right panel of n. All testing was two-tailed.
