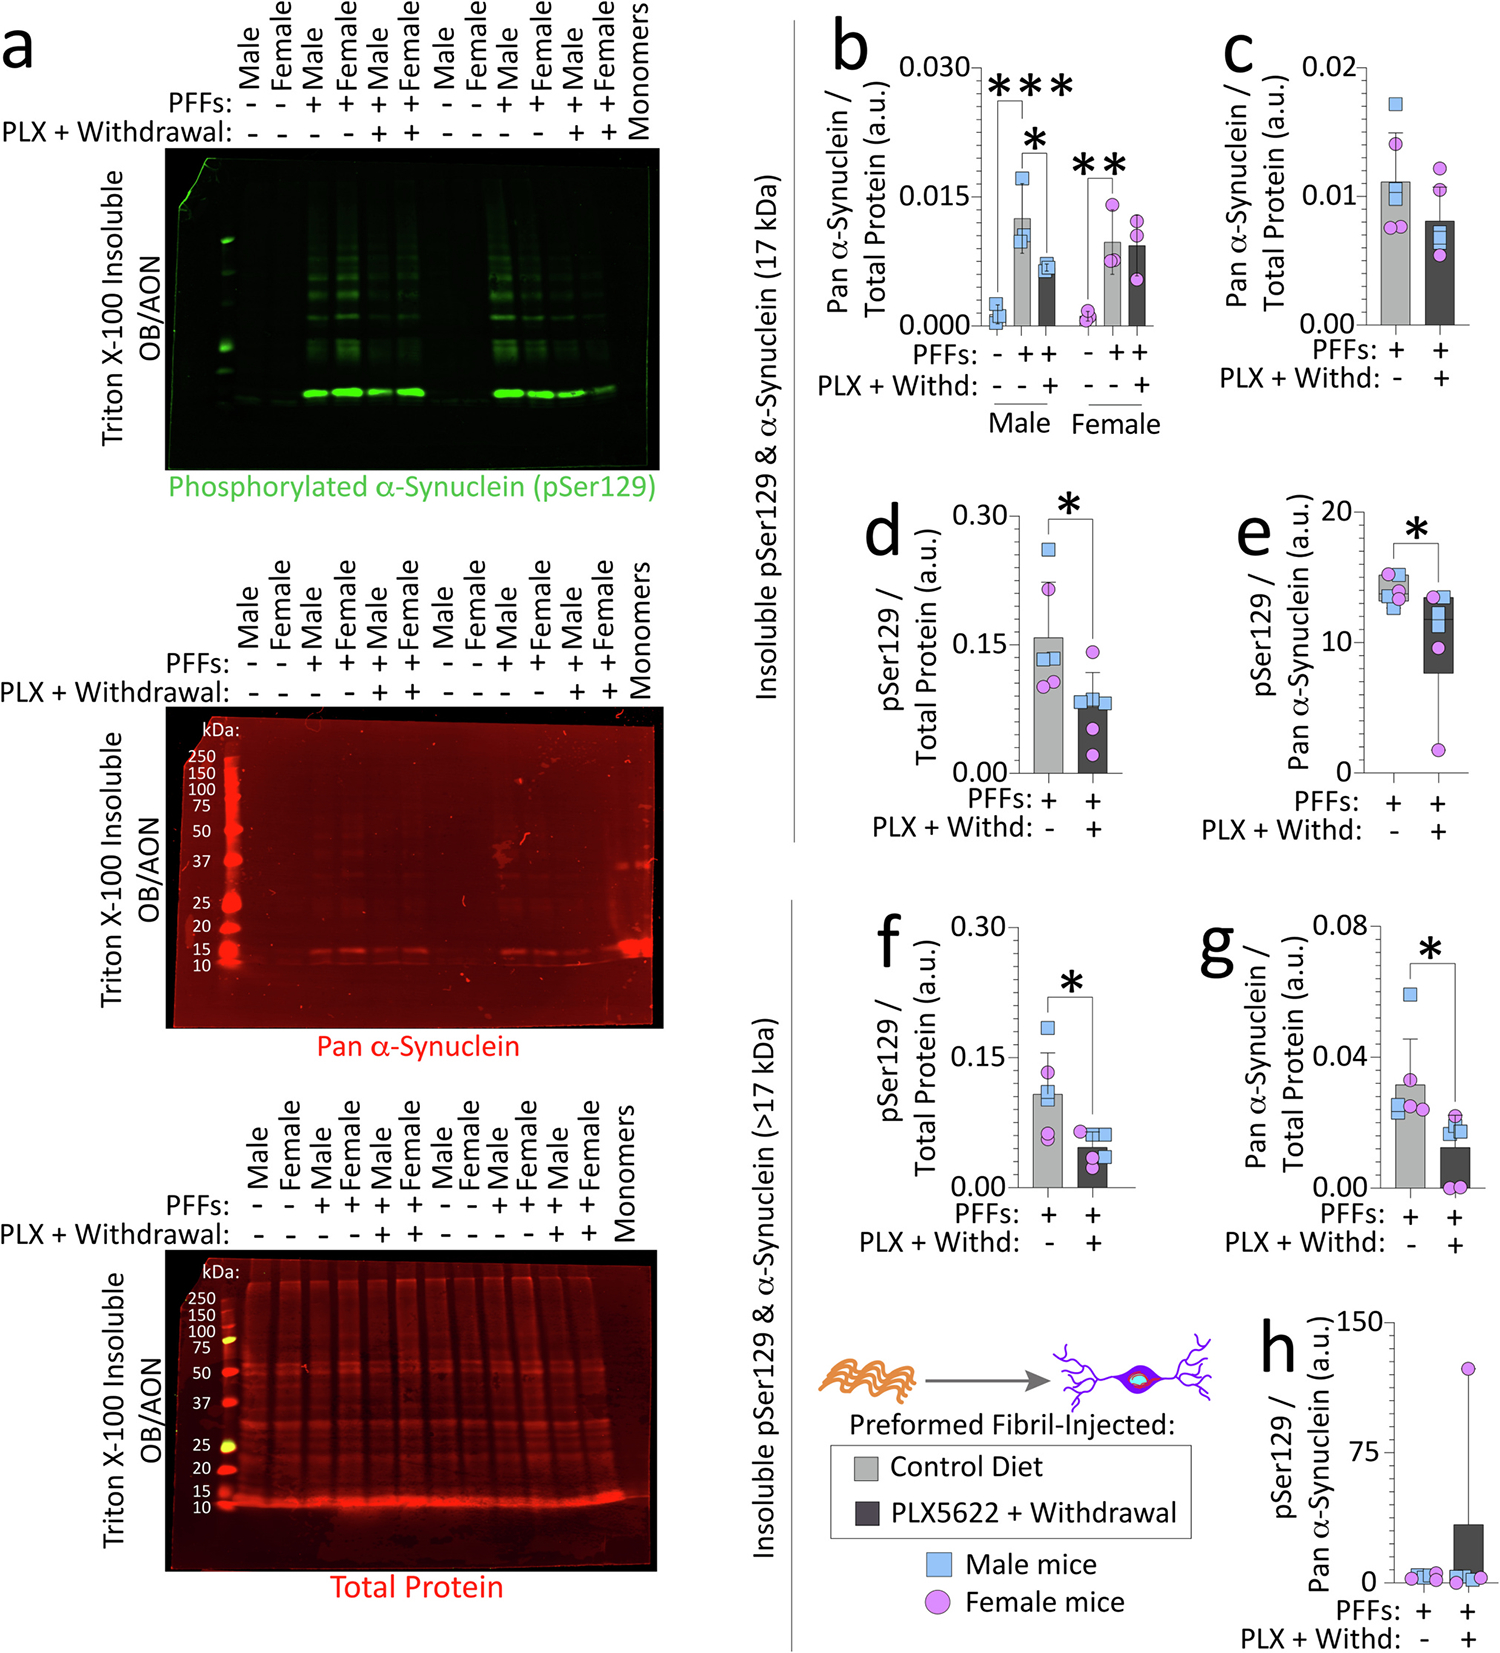
Fig. 3. Transient exposure to PLX5622 (2-weeks “ON” and 7-weeks “OFF”) lowers nonionic detergent-insoluble phosphorylated and pan-α-synuclein in the OB/AON of preformed fibril-injected aged mice.

Aged, outbred CD-1 mice of both sexes were fed special chow with or without the CSF1R inhibitor, PLX5622, for two weeks, and then fed standard rodent chow for an additional 7 weeks (timeline in Fig. 1a). Preformed fibrils (PFFs; 5 μg in 1 μL) were injected into the bulbar anterior olfactory nucleus (OB/AON) seven days after initiation of the PLX5622 diet. OB/AON tissues from PFF-injected aged mice fed control chow or transiently exposed to the PLX5622 diet were sequentially extracted to obtain nonionic, detergent-insoluble fractions, and subjected to immunoblotting to probe for pSer129 and pan-α-synuclein (Volpicelli-Daley et al., 2014). OB/AON tissues from PBS-injected aged mice were included as controls and wild-type mouse α-synuclein monomers were loaded in the last lane to evaluate antibody specificities (a; higher-resolution image of the blot is in Fig. S8a). Note that monomeric α-synuclein migrates at ~16–17 kDa through denaturing gels, based on immunoblot in a and (Anderson et al., 2006; Sharon et al., 2001). Insoluble pSer129 and pan-α-synuclein bands at 17 kDa were quantified (b-e) separately from bands of higher molecular mass (> 17 kDa; f-h) and expressed as a fraction of the Total Protein Stain as a loading control. Levels of insoluble pSer129 were also expressed as a fraction of pan-α-synuclein in e and h. Additional data from these experiments are shown in Fig. S8. For studies in Figs. 3 and S8, three murine OB/AON samples had to be collapsed into one. Each group has three dots/statistical units, but data were generated from nine mice per group (see Methods). Shown are group means + SDs or box plots with interquartile ranges. *p ≤ 0.0500, **p ≤ 0.0100, ***p ≤ 0.0010; Mann-Whitney U (boxplots in e, h), unpaired t-test (c-d and f-g), or two-way ANOVA/Bonferroni (b). All testing was two-tailed.
