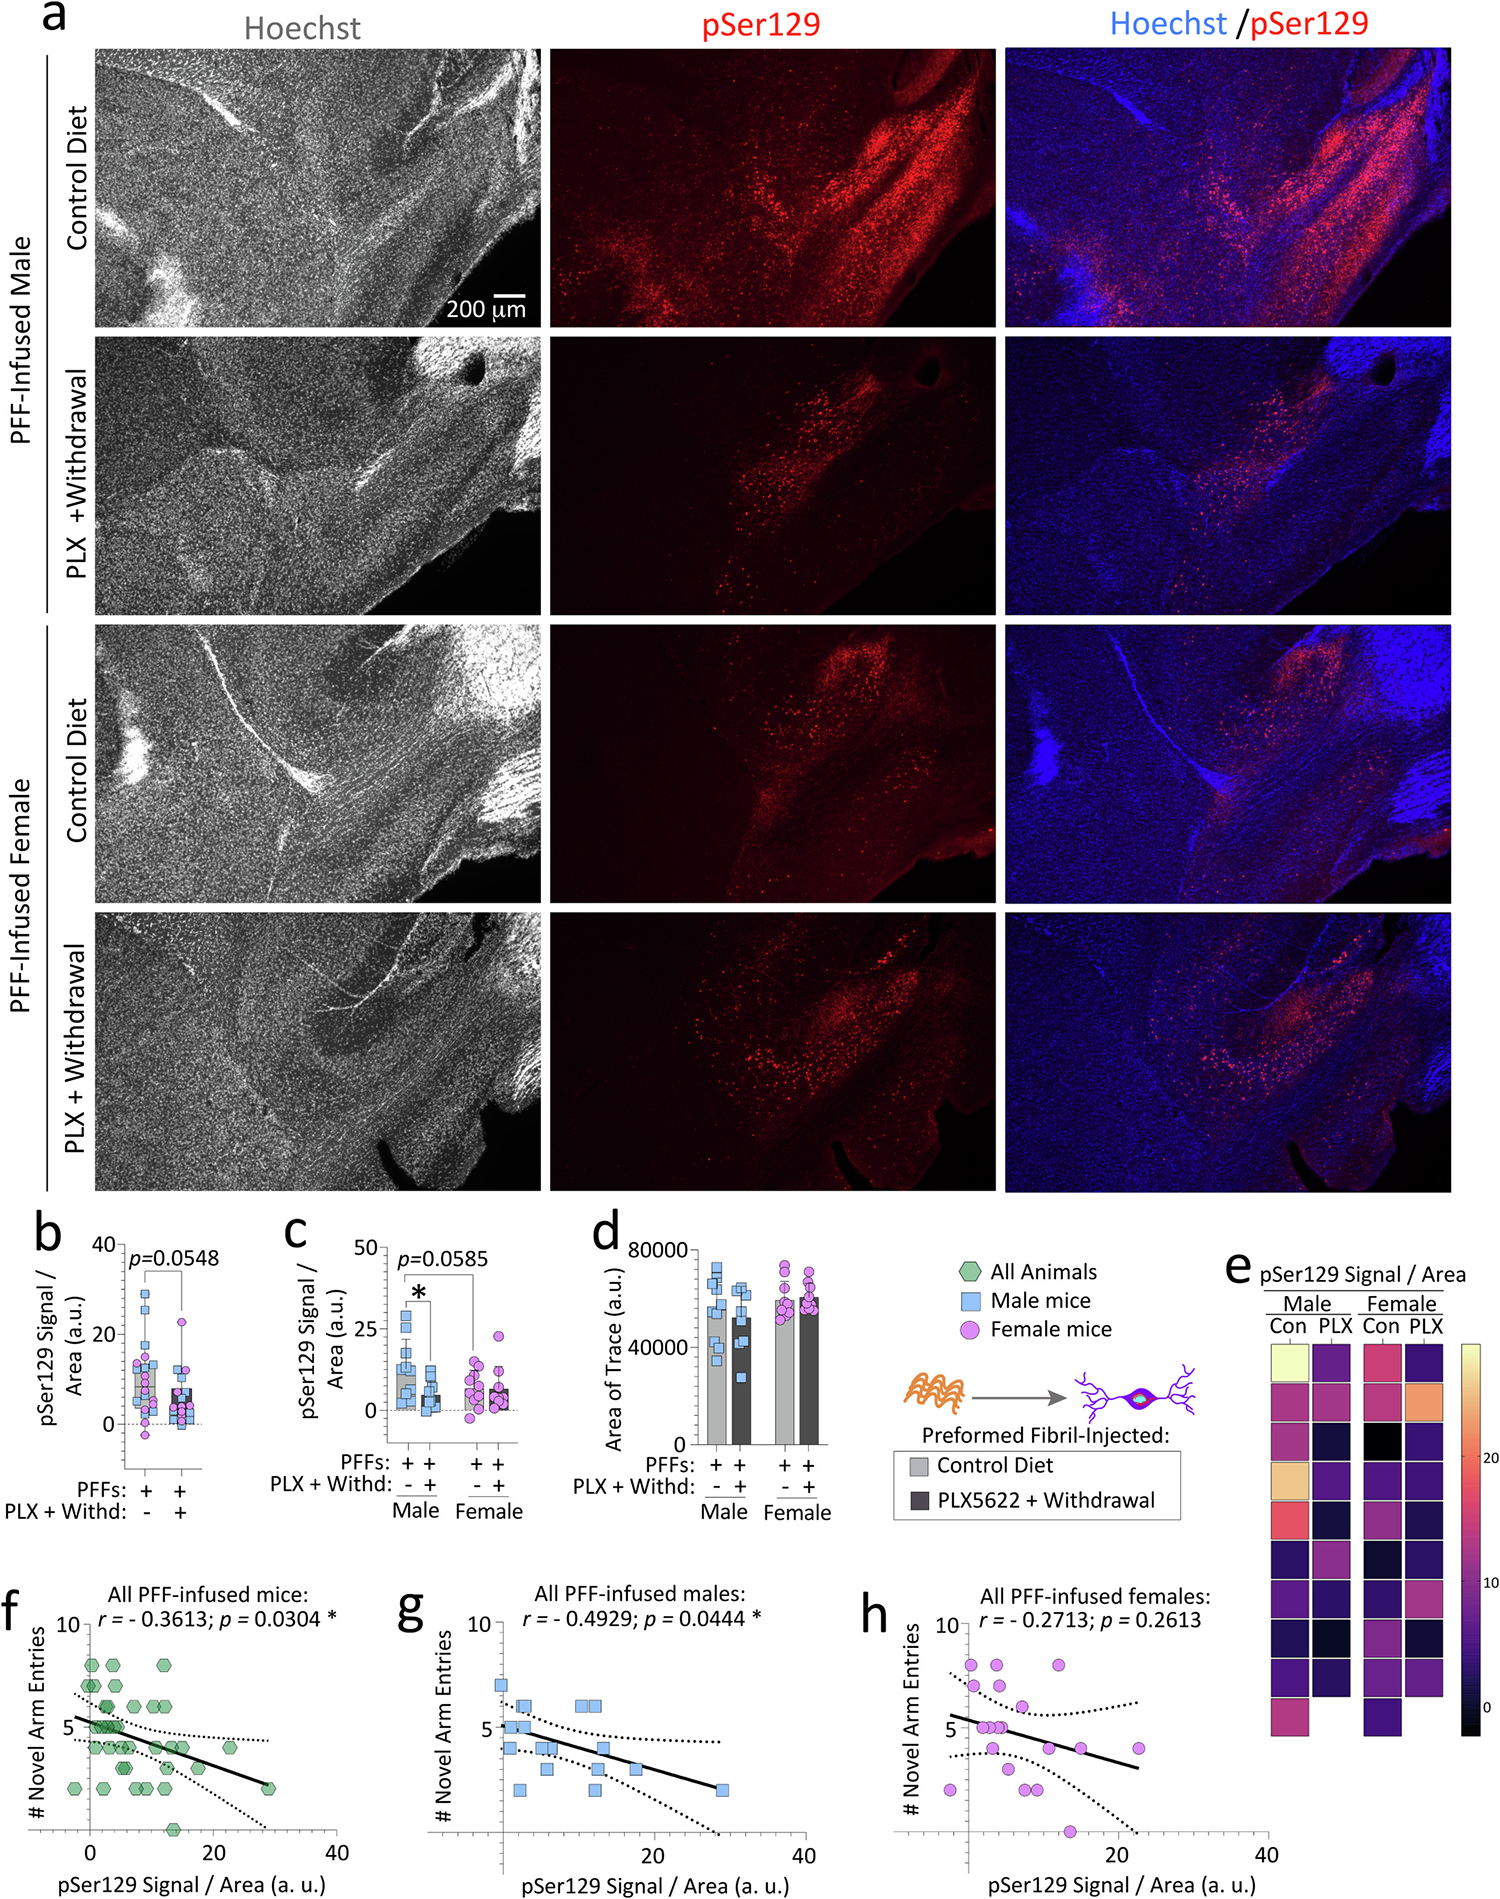
Fig. 4. Transient exposure to PLX5622 (2-weeks “ON” and 7-weeks “OFF”) reduces phosphorylated α-synuclein in the olfactory peduncle of preformed fibril-injected aged male but not female mice.

Aged, outbred CD-1 mice of both sexes were fed special chow with or without the CSF1R inhibitor, PLX5622, for two weeks, and then fed standard rodent chow for an additional 7 weeks (timeline in Fig. 1a). Preformed fibrils (PFFs; 5 μg in 1 μL) were injected into the bulbar anterior olfactory nucleus seven days after initiation of the PLX5622 diet. Brain sections were subjected to Tyramide Signal Amplification to improve the signal-to-noise ratio of the pSer129 immunolabel, scanned on an Odyssey Imager M at a resolution of 5 μm, and the olfactory peduncle (Brunjes et al., 2011) was outlined to obtain the pSer129 signal. pSer129 signal was then divided by the area of each trace (b-d). Representative photomicrographs of Hoechst-stained and pSer129-immunolabeled anterior olfactory nuclei are shown in a. Heatmap depicting the pSer129 signal per unit area of the olfactory peduncle from all mice is in e. Correlation analyses of the numbers of novel arm entries (from the Y-maze forced alternation test shown in Fig. 2) with the pSer129 signal in the olfactory peduncle of all PFF-infused mice (f) or of PFF-infused males vs. females (g-h). Note that two mice were excluded from the Y-maze and inclusion assays due to dermatitis and abdominal abscesses (see Methods). In addition, mice that made less than three arm entries during the first minute of the second Y-maze trial were also excluded from the behavior correlations (see SI Methods and (Wolf et al., 2016)). Each mouse is illustrated as a colored dot on bar graphs with group means + SDs, on box plots with interquartile ranges, or in scatterplots for correlations. *p ≤ 0.0500; Mann-Whitney U (boxplot in b) or two-way ANOVA/Bonferroni (c-d). Pearson correlation analyses are shown in f-h. All testing was two-tailed.
