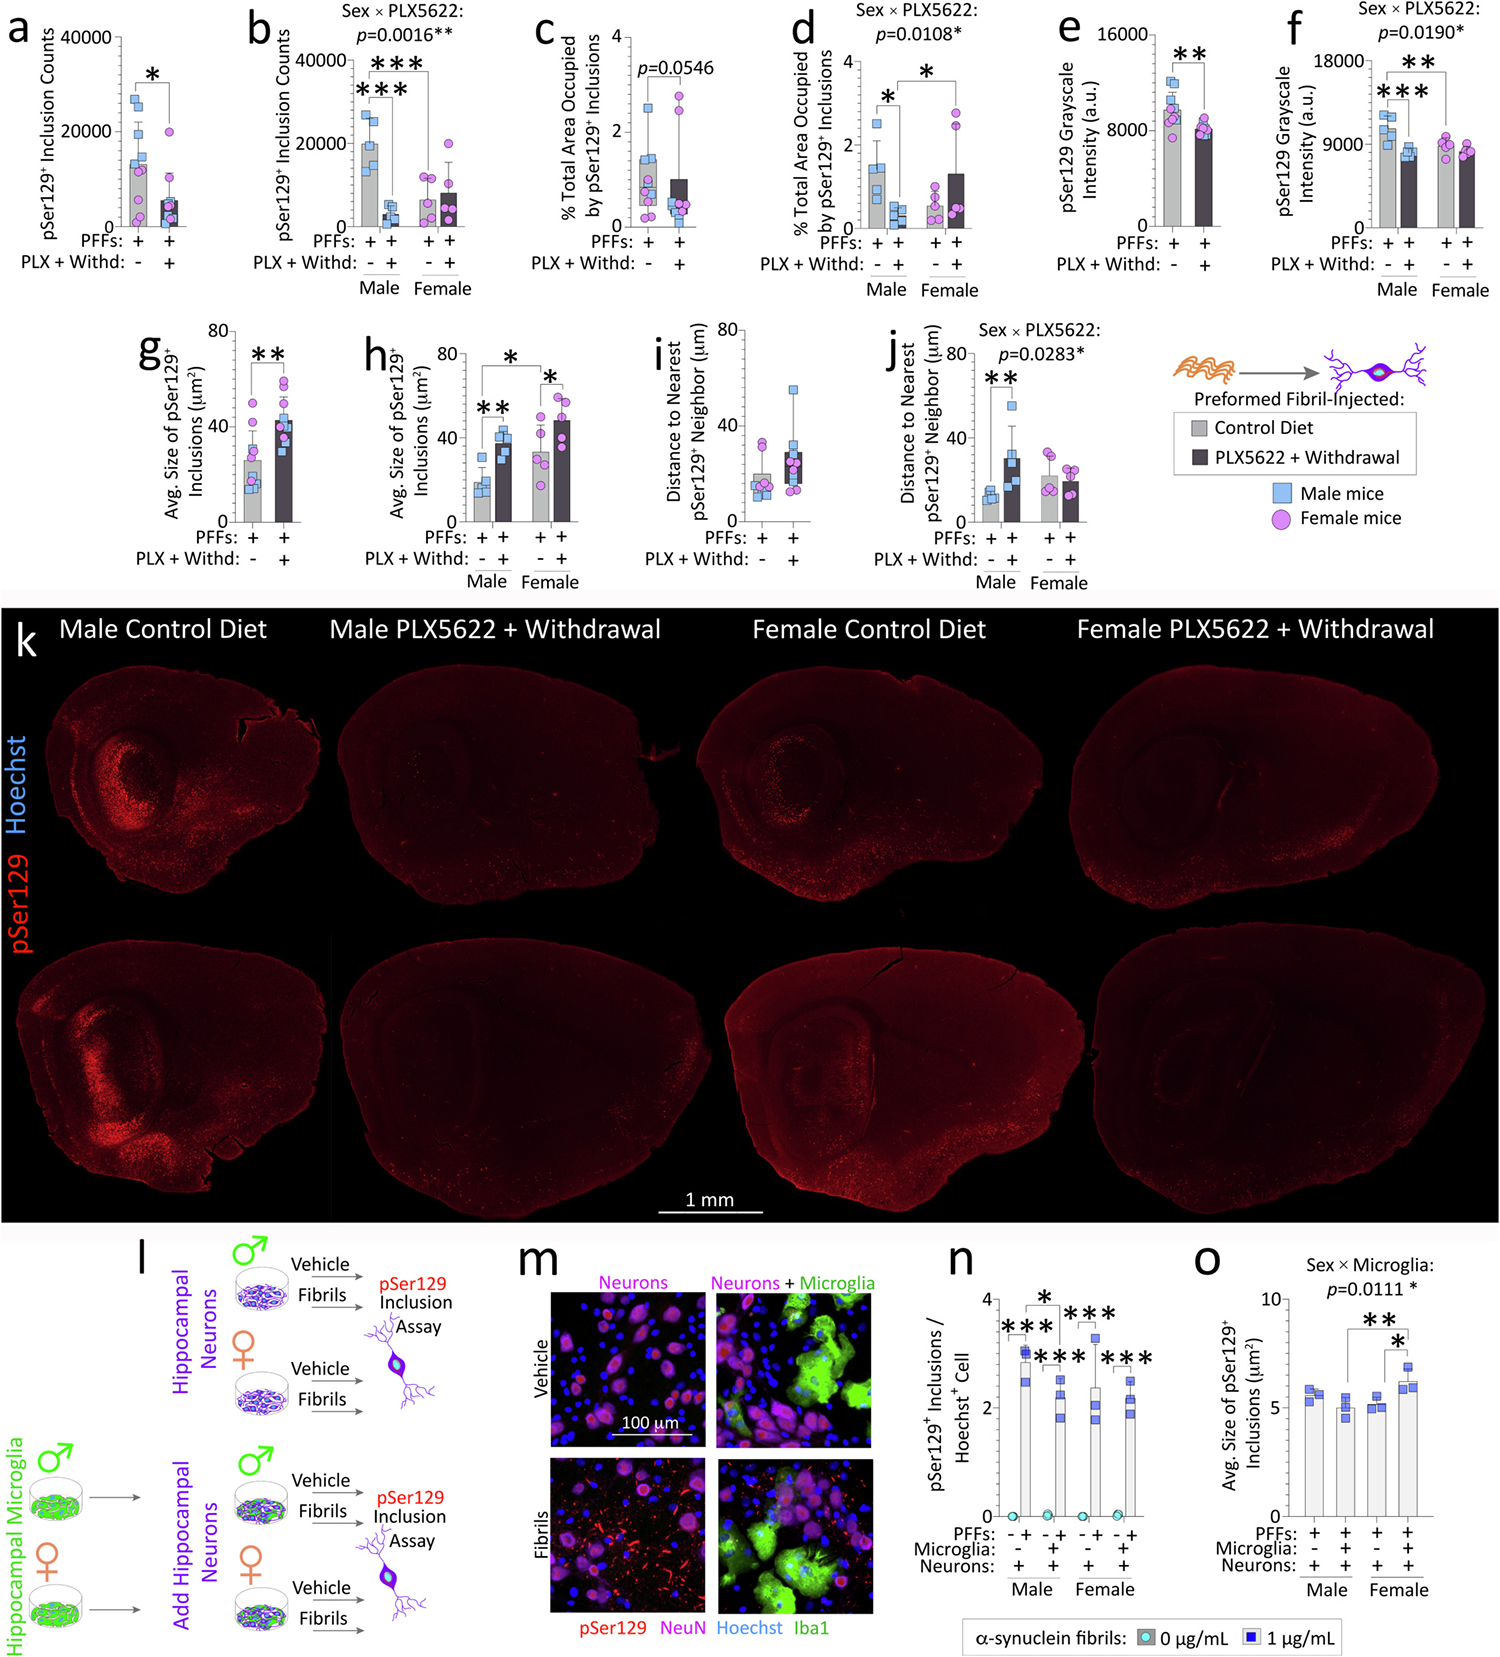
Fig. 5. Sex-specific regulation of pSer129+inclusion numbers and sizes in PFF-injected aged mice after transient PLX5622 exposure (2-weeks “ON” and 7-weeks “OFF”).

Aged, outbred CD-1 mice of both sexes were fed special chow with or without the CSF1R inhibitor, PLX5622, for two weeks, and then fed standard rodent chow for an additional 7 weeks (timeline in Fig. 1a). Preformed fibrils (PFFs; 5 μg in 1 μL) were injected into the bulbar anterior olfactory nucleus seven days after initiation of the PLX5622 diet. Brain sections from PFF-injected aged mice (n = 5 randomized mice per group) were subjected to Tyramide Signal Amplification of the pSer129 signal and scanned on a VS200 Olympus imager (a-k). pSer129+ inclusions in the entire lateral limbic rhinencephalon were quantified via True AI/Deep Learning (Olympus) to identify the numbers of pSer129+ inclusions (a-b), % total area (area fraction) occupied by pSer129+ inclusions (c-d), mean grayscale intensity of pSer129+ inclusions (e-f), average sizes of the individual pSer129+ inclusions (g-h), and the distance to the nearest pSer129+ neighbor (i-j). Representative photomontage of the pSer129 staining (k; for higher resolution image and Hoechst labeling, please download Fig. S9). Young primary hippocampal neurons from male or female rat pups were cultured with or without sex-matched primary hippocampal microglia (l-o). Neurons and neuron/glia cocultures were exposed to vehicle or PFFs for 10 d. pSer129+ inclusions were expressed as a fraction of Hoechst+ cells (n). Average sizes of pSer129+ inclusions (o). Intervariable statistical interactions are shown above respective graphs. Each mouse (or each in vitro culture from one litter of pups) is illustrated as a colored dot on bar graphs with group means + SDs or on box plots with interquartile ranges. *p ≤ 0.0500, **p ≤ 0.0100, ***p ≤ 0.0010 for indicated comparisons; two or three-way ANOVA/Bonferroni (b, d, f, h, j, n-o), Mann-Whitney U (c, i), unpaired t-test (a, e, g). All testing was two-tailed.
