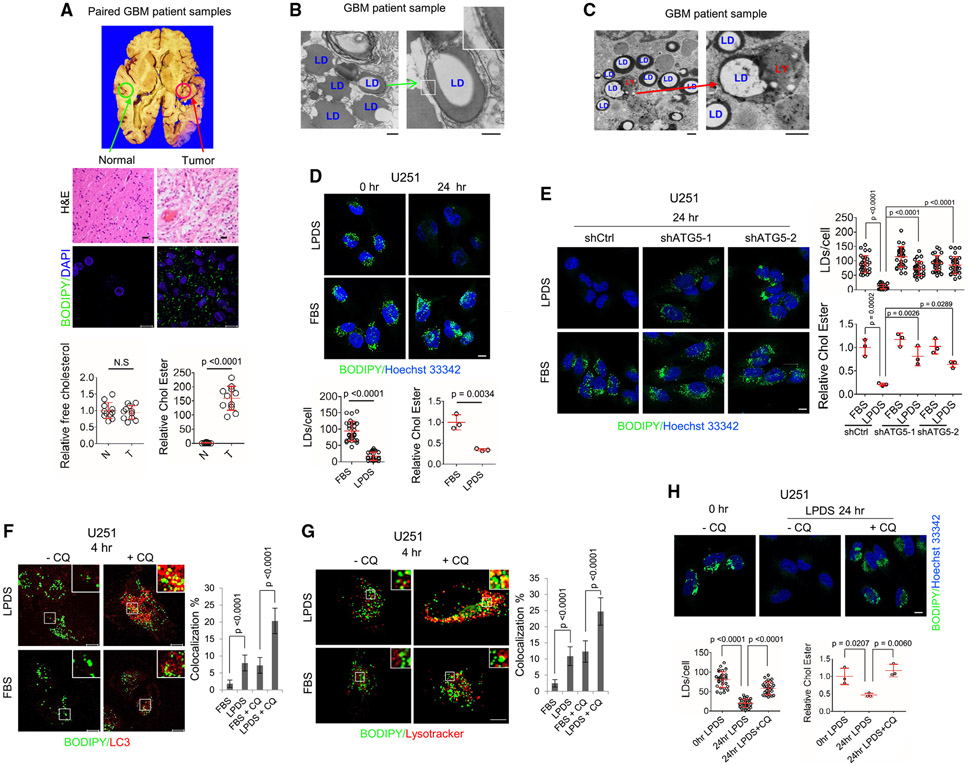
Figure 1. Cholesterol reduction induces autophagy to hydrolyze LD-bound CEs in GBM cells.
(A) Representative images of H&E (top panels) or BODIPY 493/503 (green)/DAPI (blue) staining (middle panels) of paired GBM tumor and healthy brain tissues from human patient autopsies. Free cholesterol and CE in paired GBM tumor tissues vs. healthy brain tissues from patient autopsies (n = 11) were determined by cholesterol measuring kit (mean ± SD) (bottom panels). Statistical significance was analyzed by an unpaired Student’s t test. N.S, not significant. Scale bars, 10 μm in fluorescence images and 50 μm in H&E images.
(B and C) Representative transmission electron microscopy (TEM) images of tumor tissues from GBM patient biopsies. Green arrows indicate the double-membrane vesicle that engulfs LDs (B); red arrow shows that LD is entrapped in the lysosome (LY) (C). Scale bars, 500 nm.
(D) Representative confocal images of BODIPY 493/503 (green) staining in live U251 cells cultured in 5% FBS or 5% LPDS media for 0 or 24 h (top panels). Nuclei were stained with Hoechst 33342 (blue). LDs were quantified by ImageJ software from 30 cells (mean ± SD), and CEs were determined by a cholesterol/CE measuring kit (mean ± SD) (bottom panels). Statistical significance was analyzed by an unpaired Student’s t test.
(E) Representative confocal images of BODIPY 493/503 (green) staining in live U251 cells with shATG5 vs. shRNA control cells cultured in 5% FBS or 5% LPDS for 24 h (left panels). LDs and CE were determined as above.
(F and G) Representative confocal images of co-staining of BODIPY 493/503 (green)/LC3 (red) (F) and BODIPY 493/503 (green)/LysoTracker (red, staining the LYs) (G) in U251 cells cultured in 5% FBS or 5% LPDS media in the absence or presence of CQ (5 μM) for 4 h. The co-localization (yellow) of BODIPY-stained LDs with LC3-stained puncta (F) or lysotracker-stained LYs (G) was quantified by ImageJ software from 30 cells (mean ± SD).
(H) Representative confocal images of BODIPY 493/503 (green) staining in live U251 cells cultured in 5% LPDS media in the absence or presence of CQ (5 μM) for 0 and 24 h (top panels).
Statistical significance for (E)–(H) was analyzed by one-way ANOVA. Scale bar, 10 μm for (D)–(H).
Please also see Figures S1 and S2 and Videos S1 and S2.

