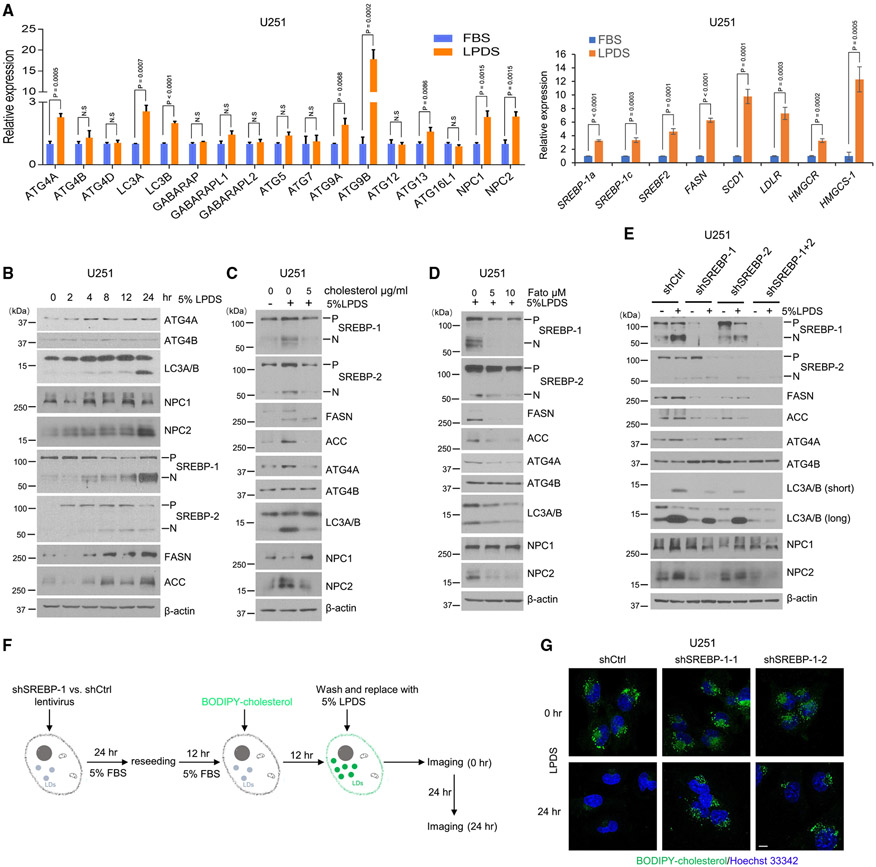
Figure 2. Cholesterol depletion activates SREBP-1 to induce lipophagy for CE hydrolysis.
(A) Real-time PCR analysis of mRNA expression (mean ± SD) of autophagy-related genes (left panel) and lipid-related genes (right panel) in U251 cells cultured in 5% FBS or 5% LPDS for 24 h. Statistical significance was analyzed by an unpaired Student’s t test. N.S, not significant.
(B) A representative western blot of U251 cells cultured in 5% LPDS at indicated time course.
(C) A representative western blot of U251 cells cultured in 5% LPDS vs. control 5% FBS labeled by minus symbol (−) in the absence or presence of supplemental cholesterol (5 μg/mL) for 40 h.
(D) A representative western blot of U251 cells cultured in 5% LPDS in the absence or presence of SREBP inhibitor fatostatin for 40 h.
(E) A representative western blot of U251 cells with shRNA silencing of SREBP-1 and −2 compared with shRNA control cells cultured in 5% FBS (−) or 5% LPDS (+) for 40 h. P, precursor; N, N-terminal active form of SREBPs.
(F and G) Schematic diagram illustrating the paradigm (F) to visualize the dynamic changes of BODIPY-cholesterol-labeled LDs in LPDS culturing (F). Representative confocal imaging of BODIPY-cholesterol-labeled LDs (green) in U251 cells with shSREBP-1 vs. shRNA control cells cultured in 5% LPDS for 0 and 24 h (G). Nuclei were stained with Hoechst 33342 (blue). Scale bar, 10 μm.
Please also see Figures S2 and S3.

