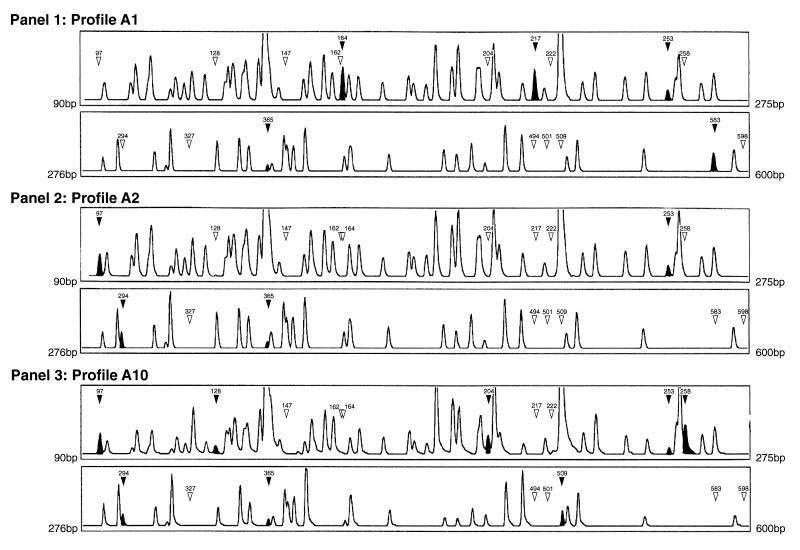
FIG. 1.
GeneScan 2.1 software-derived electropherograms (FAFLP profiles) for EcoRI+0 plus MseI+T amplifications of three GAS genomes. Panel 1, profile A1; the first outbreak strain (Table 1); the two sections represent FAFLP fragments from 90 to 275 bp and from 276 to 600 bp, respectively. Panel 2, profile A2; the second outbreak strain. Panel 3, profile A10; a non-outbreak-related isolate which had the same PFGE profile as that of the second outbreak strain shown in panel 2. The solid arrowheads and peaks indicate a fragment characteristic of that profile (sizes are indicated in base pairs). Open arrowheads indicate the absence of a polymorphic fragment from that profile.

