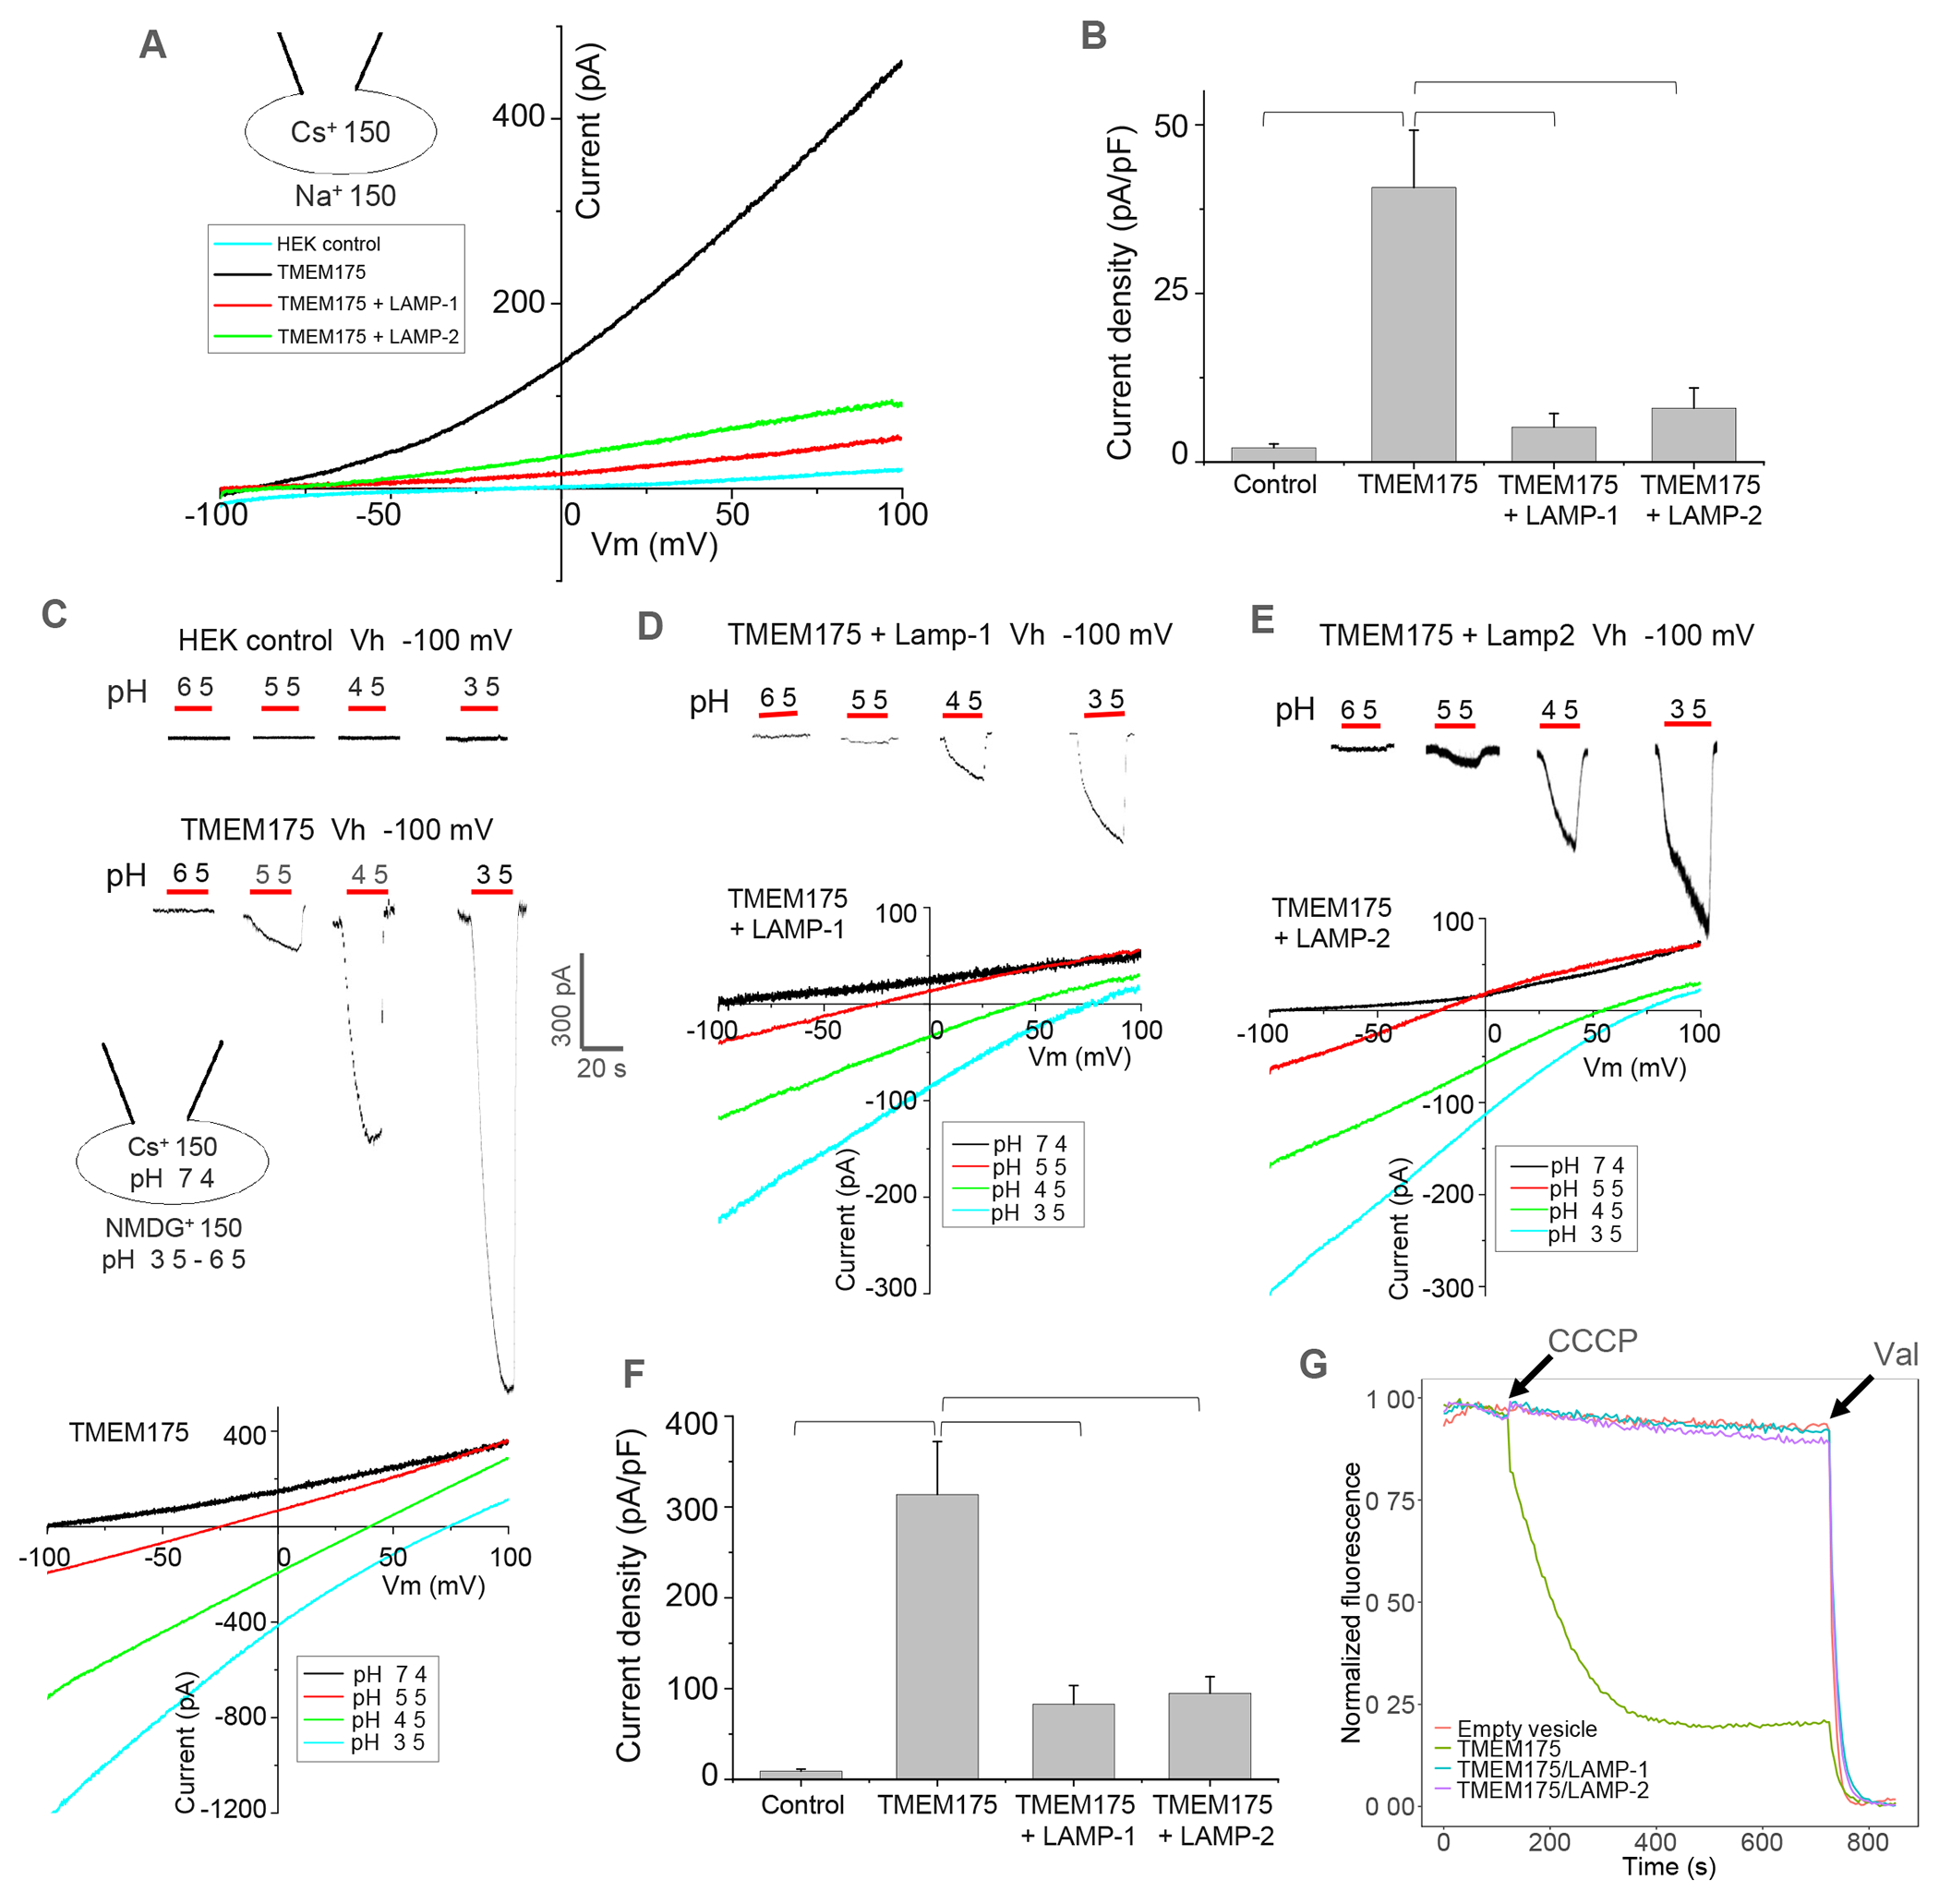
Figure 2. LAMP binding inhibits the channel activity of TMEM175.

(A) Sample I-V curves of HEK293 cells expressing TMEM175 with LAMP-1 or 2. Outward Cs+ currents were recorded using whole-cell patch clamp at pH 7.4 with 150 mM Na+ in the bath (extracellular/luminal) and 150 mM Cs+ in the pipette (cytosolic).
(B) Cs+ current density of TMEM175 with or without LAMP-1 or 2 co-expression measured at 100 mV in whole-cell recordings. Data are represented as mean ± SEM (n=10, *** p <0.001, **p <0.01).
(C) Luminal acidic pH activation of TMEM175. Upper panel: sample traces of inward proton currents recorded at −100 mV with lowering bath pH. Lower panel: sample I-V curves at various bath pHs indicating the change of channel selectivity. For pH activation, Na+ was replaced by NMDG+ in low-pH bath solutions.
(D) Luminal acidic pH activation and I-V curves of TMEM175 co-expressing with LAMP-1.
(E) Luminal acidic pH activation and I-V curves of TMEM175 co-expressing with LAMP-2.
(F) Proton current density of TMEM175 with or without LAMP-1 or 2 co-expression measured at −100 mV with bath pH of 3.5 in whole-cell recordings. Data are represented as mean ± SEM (n=10, *** p <0.001, ** p <0.01).
(G) K+ flux assay using proteoliposomes containing TMEM175 or TMEM175/LAMP complexes. K+ flux was initiated by adding H+ ionophore carbonyl cyanide m-chlorophenylhydrazone (CCCP) and terminated by adding K+ ionophore valinomycin (Val). The assay was repeated 3 times with consistent results.
See also Figure S3.
