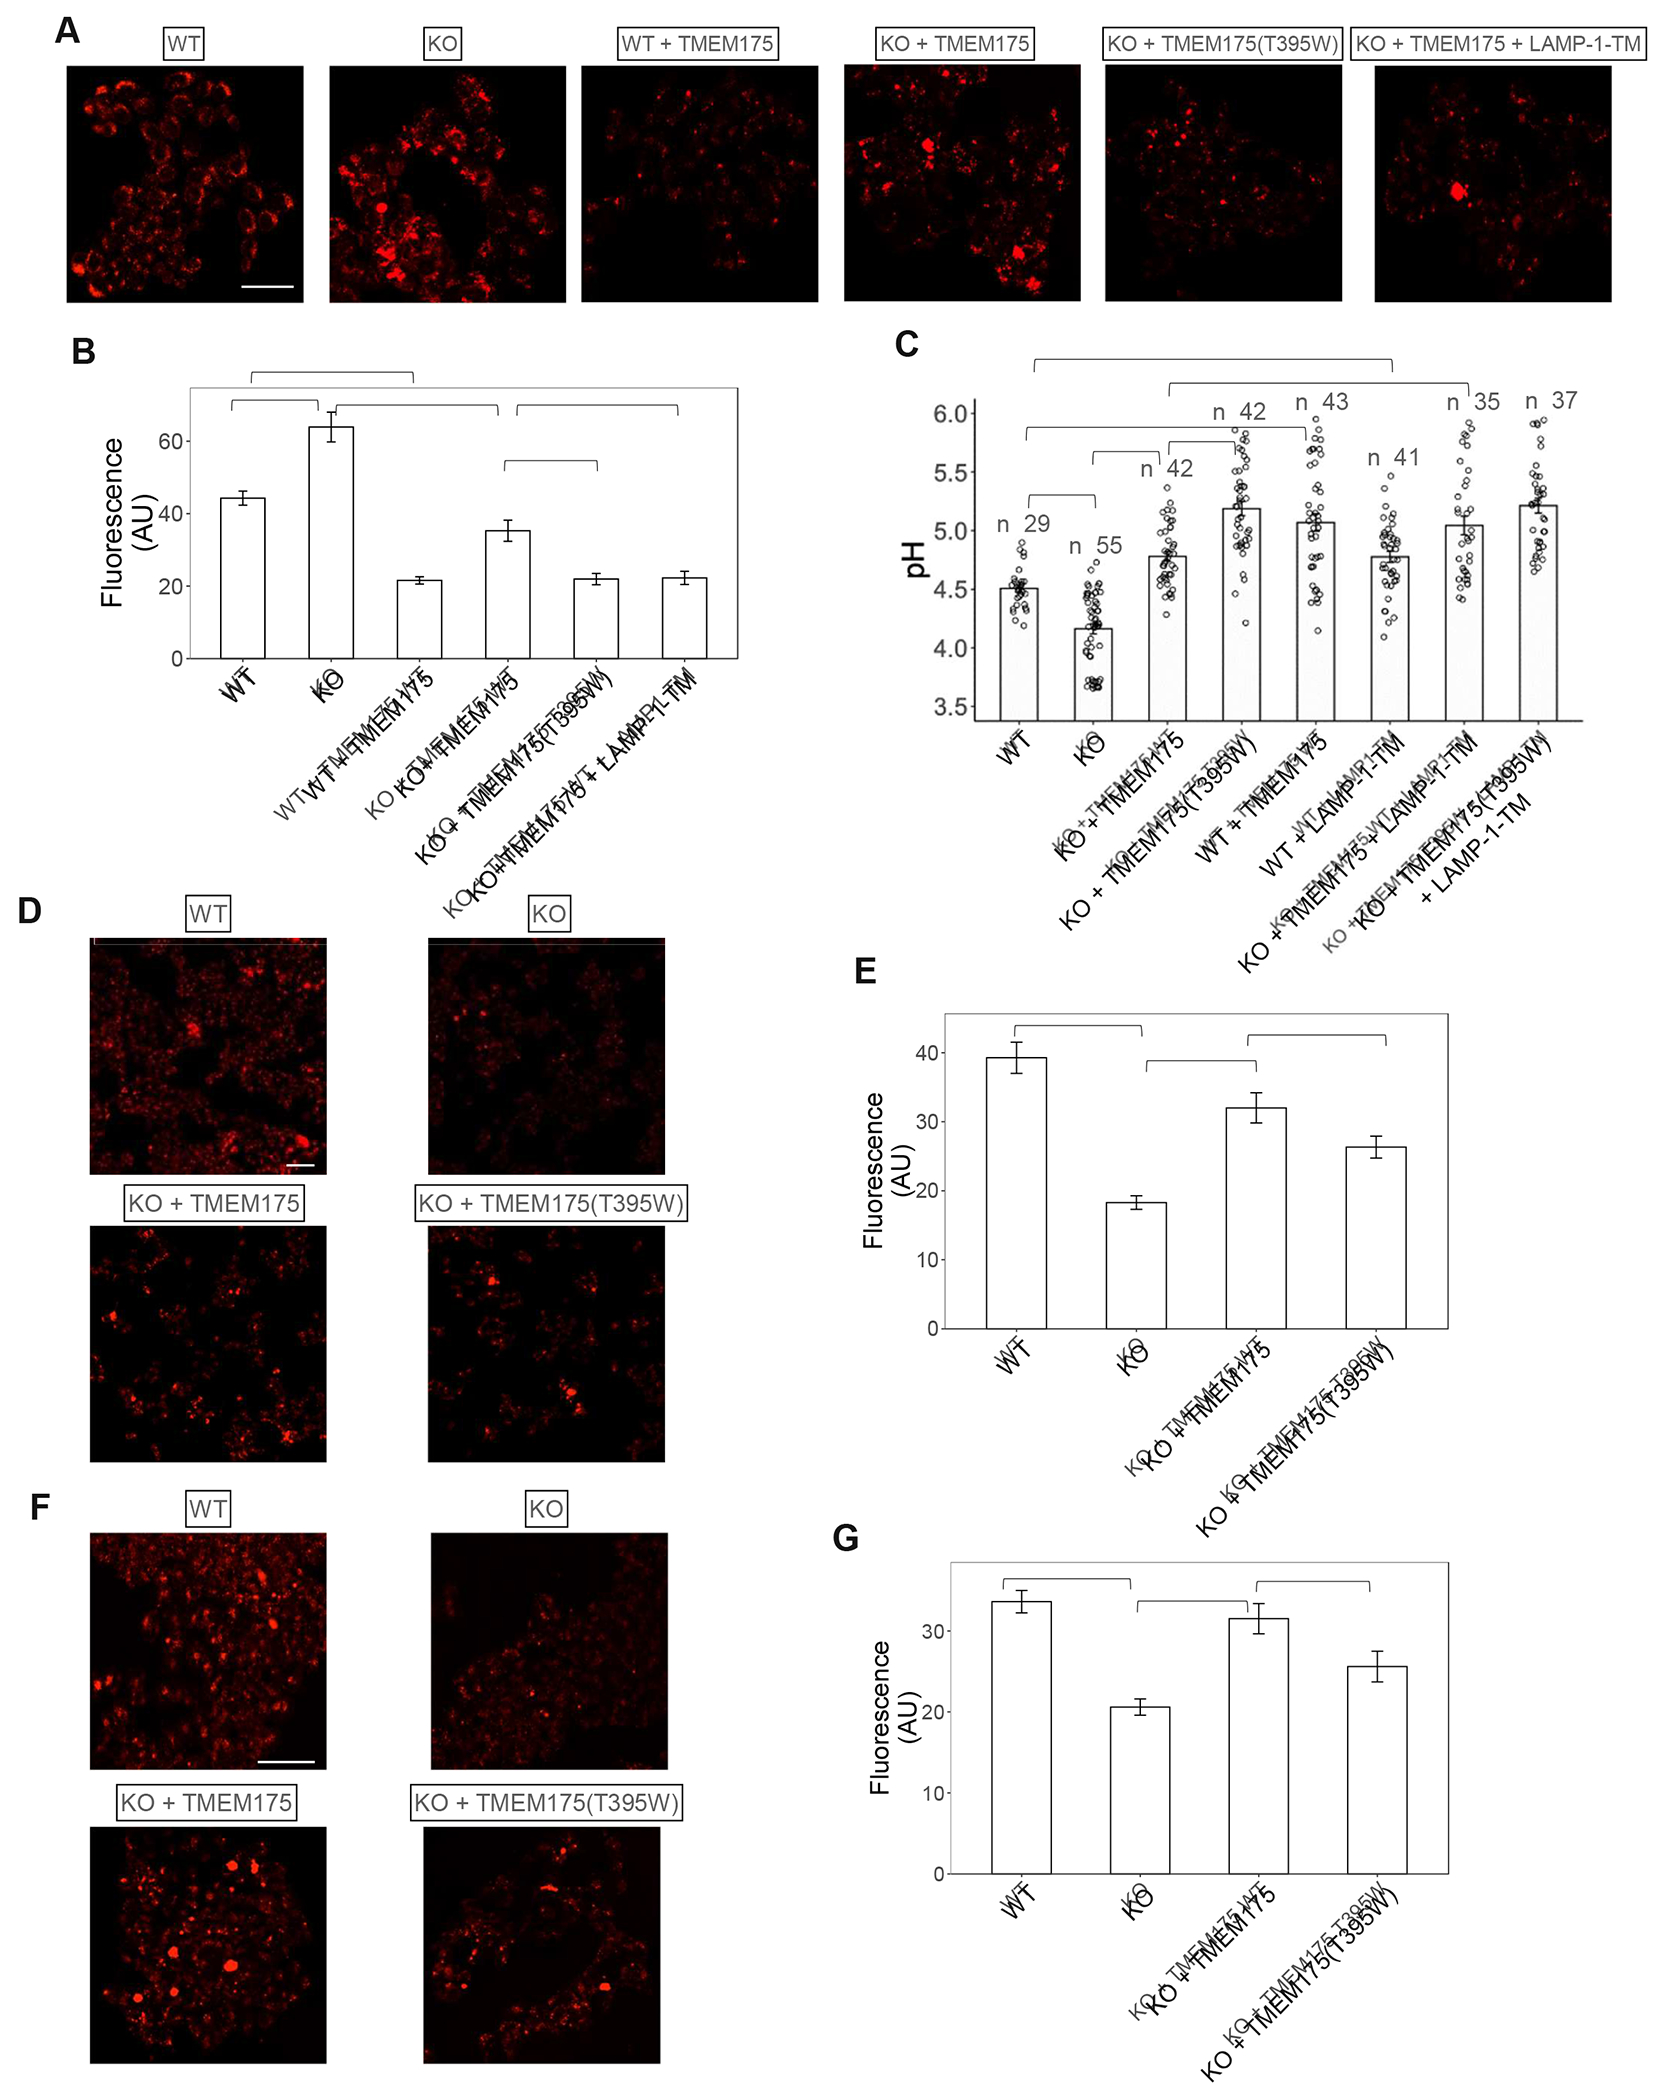
Figure 6. Lysosomal pH and hydrolytic activity measurements.

(A) Sample images of LysoTracker staining of WT and KO HAP1 cells expressing TMEM175 or its T395W mutant.
(B) Averaged LysoTracker intensity per cell. Data are represented as mean ± SEM (n= 27-30 cells, *** p <0.001).
(C) Lysosomal pH in WT and KO HAP1 cells determined using ratiometric fluorescence imaging of Oregon Green 488 Dextran. Data are represented as mean ± SEM (n = number of cells per group, *** p <0.001, ** p <0.01).
(D) & (E) Sample images of DQ™-BSA-red staining and overall intensity in WT and KO HAP1 cells expressing TMEM175 or its T395W mutant. Data are represented as mean ± SEM (n= 30 cells, *** p <0.001).
(F) & (G) Sample images Magic Red staining and overall intensity in WT and KO HAP1 cells expressing TMEM175 or its T395W mutant. Data are represented as mean ± SEM (n= 30 cells, *** p <0.001, * p <0.05).
See also Figure S7.
