
Extended Data Fig. 1 |. Cold-associated increase in cell percentages of luminal epithelium subtypes.
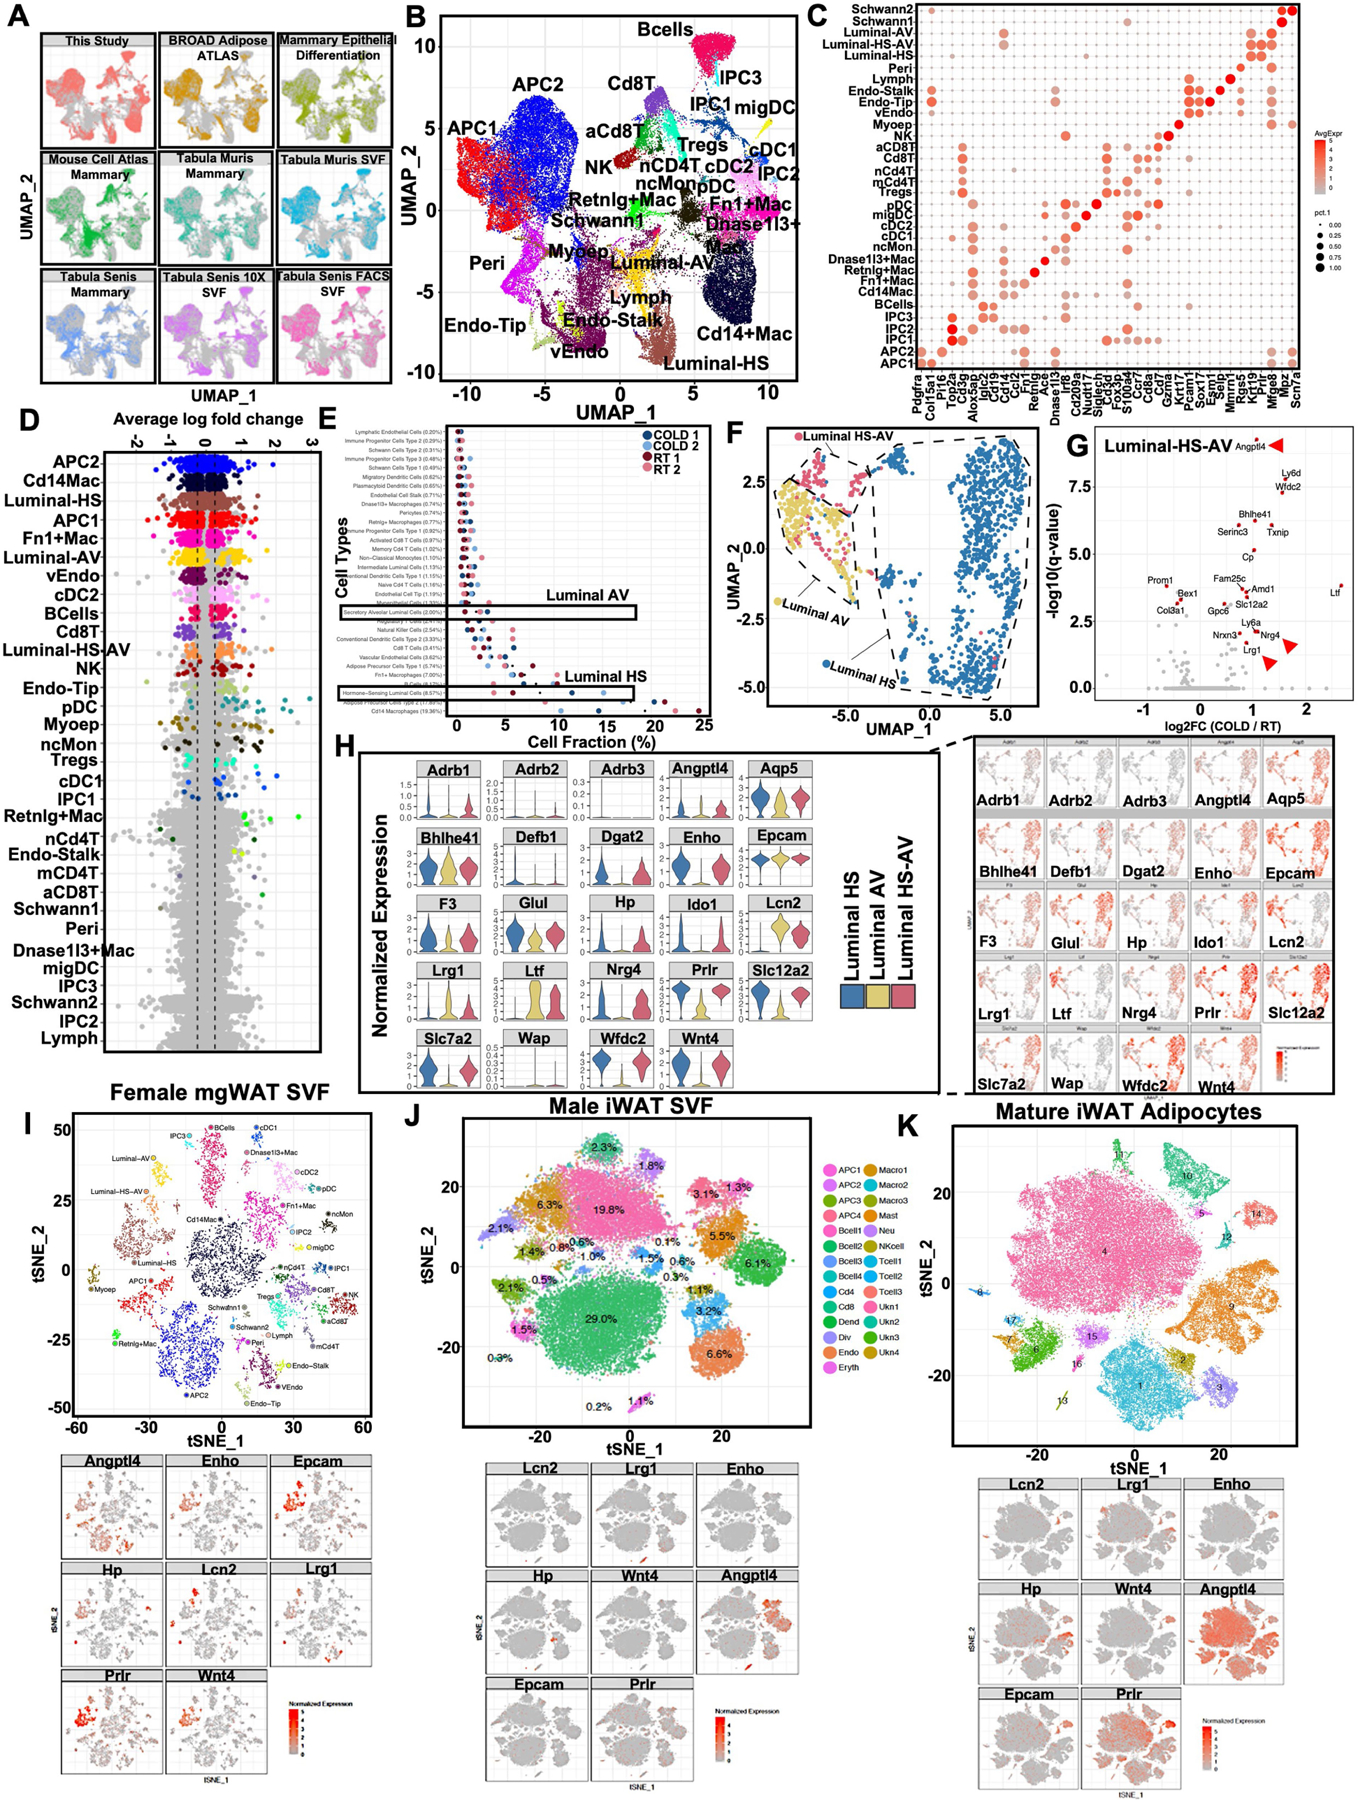
a) UMAP plots of integrated single cell data from this study and 8 external datasets (see Methods and Supplementary Table 1). Each point represents a single cell and are colored by dataset. b) UMAP plots of integrated single cell data from this study and 8 external datasets (see Methods). Each point represents a single cell and clusters are colored by cell type. c) Expression of known canonical markers for cell types in the SVF and mammary gland. Color corresponds to average expression level and size corresponds to percentage of cells which express the gene within the cluster. d) Differentially expressed genes between COLD (24 hr) treated mice and RT animals across all cell types. Significant DEGs (adjusted p-value < 0.05) are highlighted with the average log fold change between 4 degree and RT indicated on the y-axis. Cell types are ordered on the x-axis based on the number of significant DEGs. e) Relative fractions of cell types within each sample. Dots indicate average relative fractions across all samples. f) Aggregated UMAP plot of subclustering of luminal single cells from RT and cold-exposed mice. g) Differentially expressed genes between COLD treated mice and RT animals across Luminal-HS-AV. Select significant DEGs (adjusted p-value < 0.05) are highlighted with the average log fold change between 4 degree and RT indicated on the y-axis. Genes indicated by red arrows encode for secreted factors. h) UMAP and violin plots of normalized gene expression levels for genes of interest in luminal cells. Violin plots also show expression levels of Adrb1, Adrb2, and Adrb3 in luminal subtypes. i–k) tSNE plots of cell type clusters and normalized gene expression levels for genes of interest across multiple datasets including female mgWAT SVFs (i), male iWAT SVFs (j), and mature mgWAT adipocytes (k). Statistics for scRNA-seq data (d,g) was derived using Wilcoxon rank sum test between cold vs RT cells for cells and the adjusted p-value is based on Bonferroni correction.