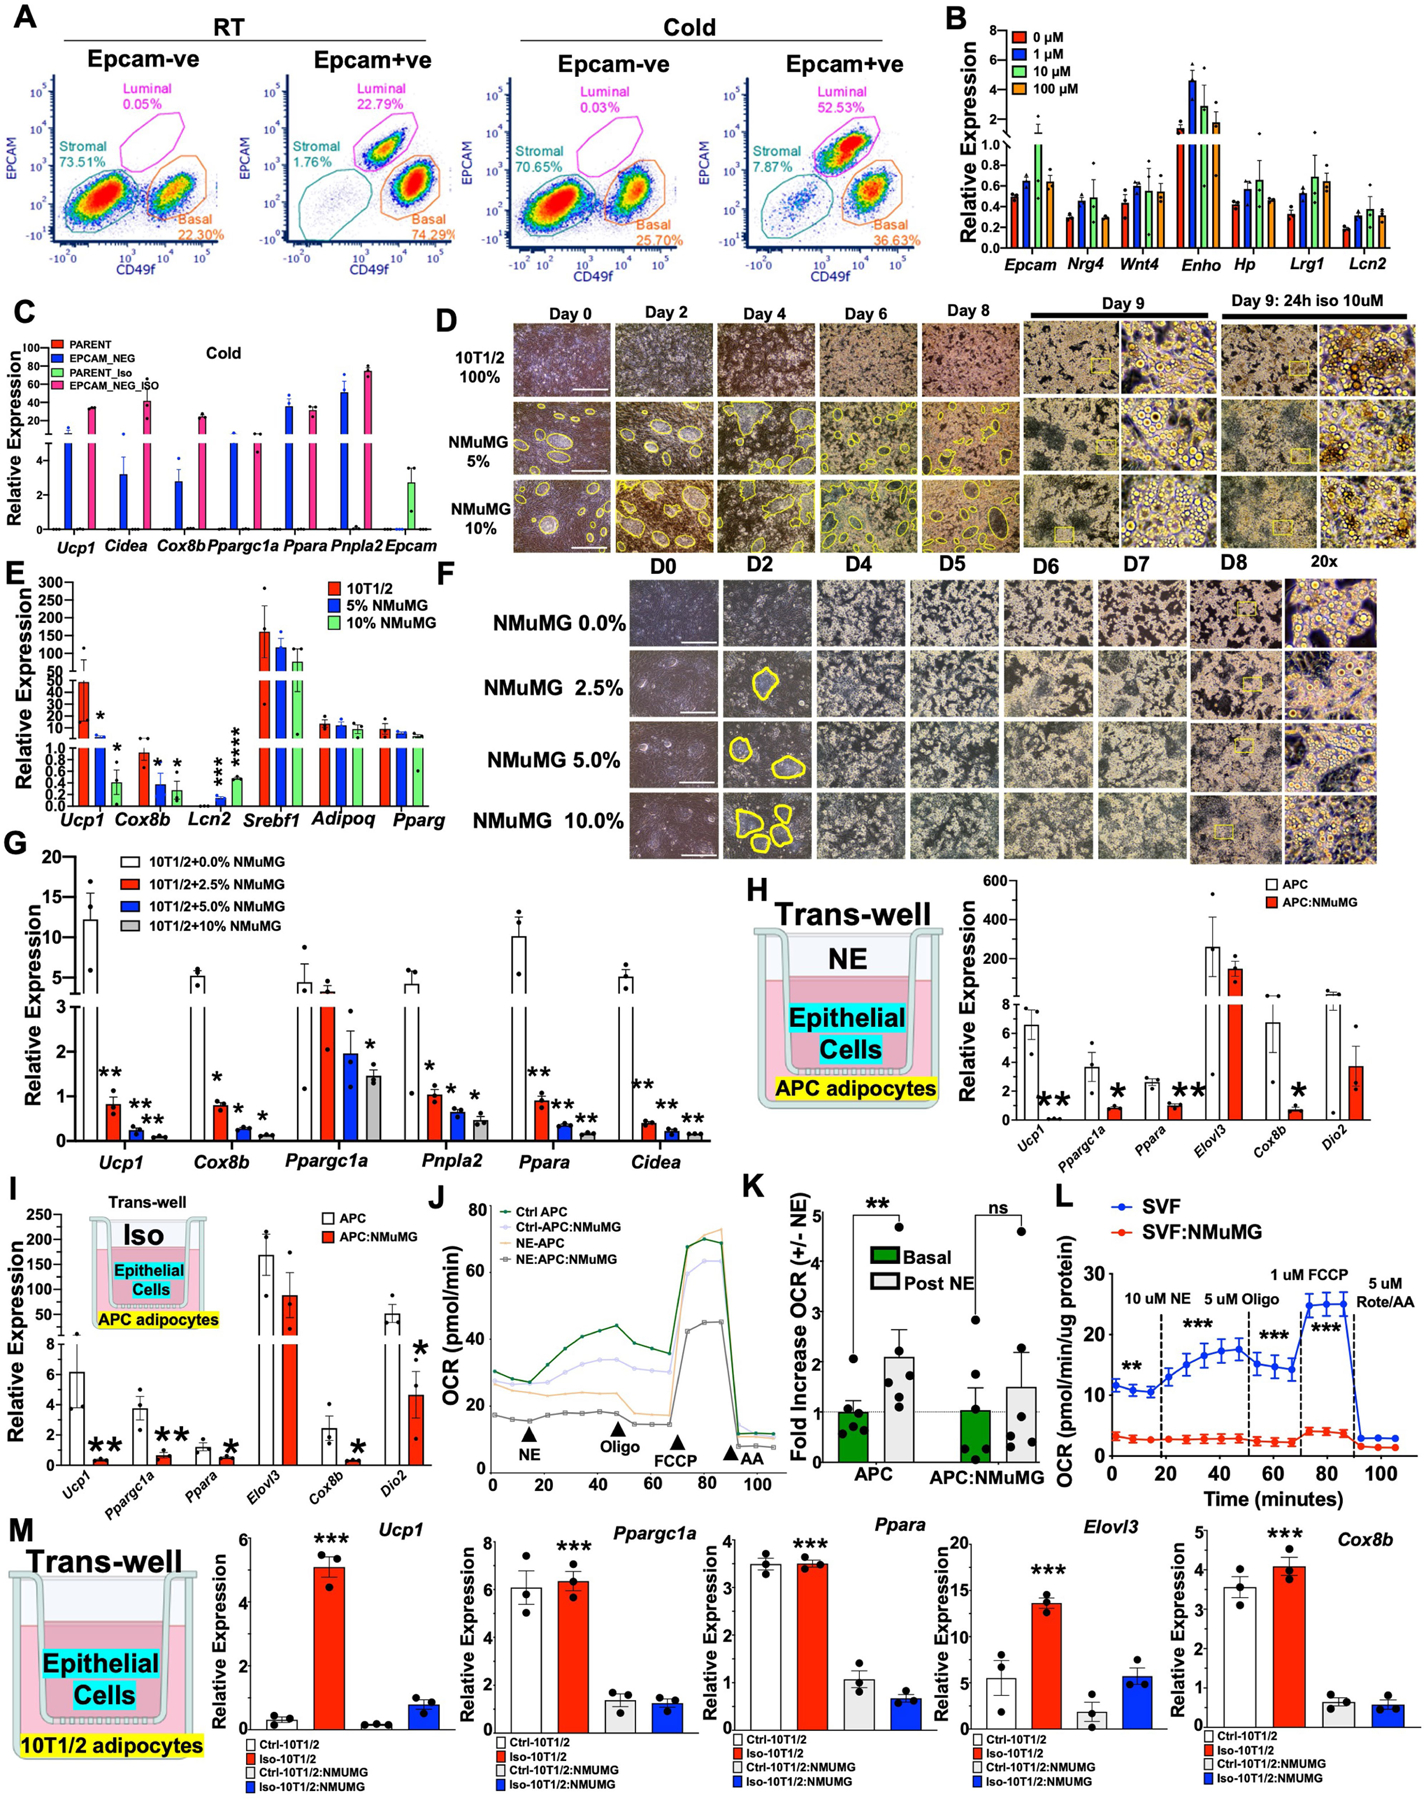
Extended Data Fig. 3 |. Mammary gland ductal epithelium inhibits cold-induced adipocyte thermogenesis.

a) Representative FACS plot of CD49f and EPCAM expression in EPCAM bead selected EPCAM+ or EPCAM-ve epithelial cells from RT or cold mice. 2 mice per condition and 4 mammary fat pads per mouse. Representative data from 4 independent experiments. b) Real-time qPCR of indicated genes in beige differentiated SVFs from mgWAT treated with indicated concentration of Iso for 5 h. c) Real-time qPCR of indicated genes from beige differentiated primary mgWAT SVF (Parent) and EPCAM-ve (EPCAM-NEG) cells isolated from cold exposed mice treated with and without 10 μM isoproterenol (ISO) for 24 h ex vivo. d) Images showing cell morphology of D0-D9 beige differentiated 10T1/2 and NMuMG (0, 5, and 10%) mixture cells. Yellow enclosures show NMuMG epithelial cells surrounded by 10T1/2 cells. Scale bar at 100 μm. e) Real-time qPCR of indicated genes from beige differentiated and Iso treated 10T1/2 and 5–10% NMuMG mixture cells. f) Images showing cell morphology of D0-D8 beige differentiated 10T1/2 and NMuMG (0–10%) mixture cells. Yellow enclosures show NMuMG epithelial cells surrounded by 10T1/2 cells. Scale bar at 100 μm. g) Real-time qPCR of indicated genes from beige differentiated and Iso treated 10T1/2 and 2.5–10% NMuMG mixture cells. h–i) Real-time qPCR of indicated genes from a transwell system of beige differentiated norepinephrine (NE) treated (h) or Iso treated (APC) (i) APCs in the presence (APC:NMuMG) or absence (APC) of NMuMG. j) Average oxygen consumption rate (OCR) in APC and APC:NMuMG pretreated with (NE-APC and NE:APC:NMuMG) and without (Ctrl APC and Ctrl-APC:NMuMG) 10 μM norepinephrine (NE) followed by acute treatment with NE (10 μM), 5 μM oligomycin (Oligo), 1 μM FCCP, and 5 μM antimycin A (AA). Mean of N = 6,6. k) Fold increase in OCR from basal respiration (J) with and without acute NE injection. N = 6,6. l) Average OCR normalized to protein level (μg protein) in SVF and SVF:NMuMG with 10 μM NE, 5 μM Oligo, 1 μM FCCP, and 5 μM AA. N = 9,9. m) Real-time qPCR of indicated genes from a transwell system of beige differentiated (Ctrl 10T1/2) or Iso treated (Iso-10T1/2) 10T1/2 cells in the presence of NMuMG with (Iso-10T1/2:NMuMG) or without iso (Ctrl-10T1/2:NMuMG). Results are from three independent experiments. *, p < 0.05; **, p < 0.01, ***, p < 0.001 comparing Iso-10T1/2 and Iso-10T1/2:NMuMG. Unpaired Student’s t Test (E,G,H,I), 2way ANOVA Bonferroni posthoc test (k,l,m), *, p < 0.05, **, p < 0.01; ***, p < 0.001, ns, not significant. Data are represented as mean ± S.E.M. Cartoon models in h,i,m created using BioRender.
