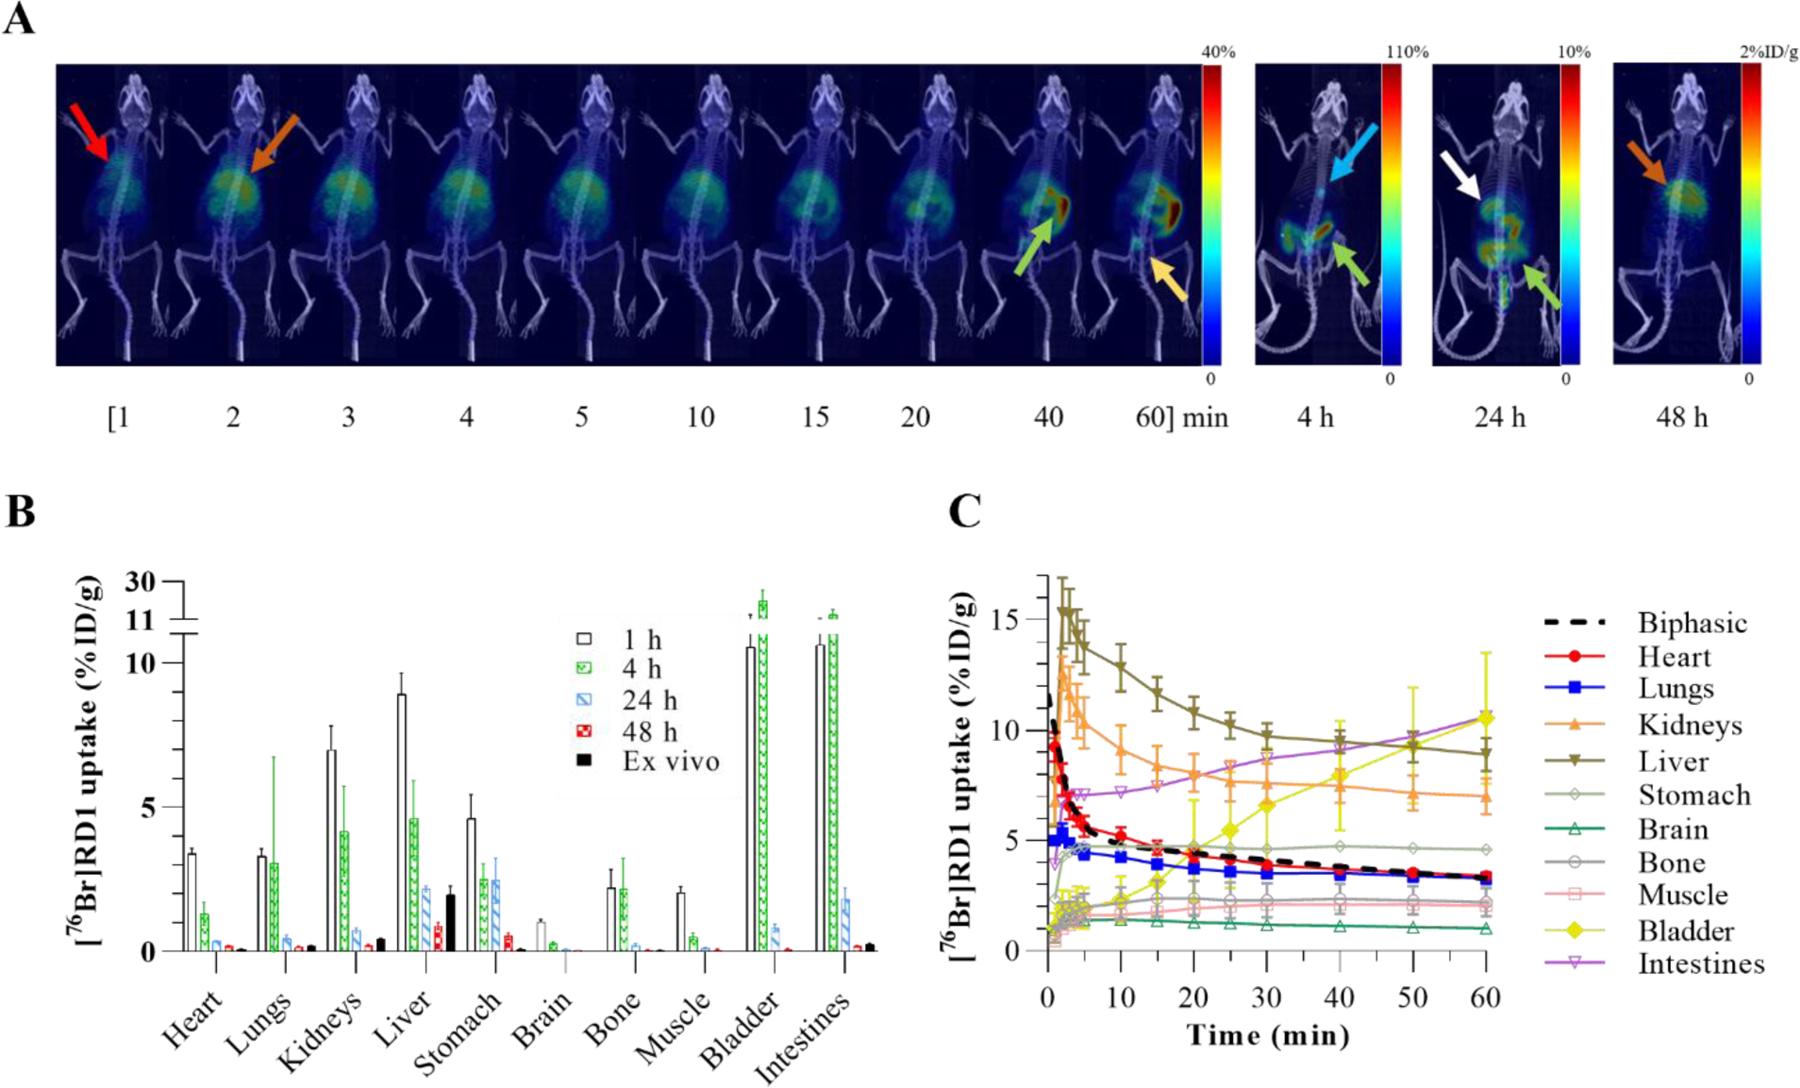
Figure 3:

(A) PET maximum intensity projection (MIP) images of a representative mouse injected intravenously with [76Br]RD1. Red arrow: heart; brown arrow: liver; green arrow: intestines; yellow arrow: bladder; blue arrow: gallbladder; white arrow: stomach contents. (B) A comparison between the in vivo measurements at four time points p.i. and the ex vivo measurements (n=4). Ex vivo intestinal uptake was the average measurement of the small intestine, large intestine, and enteric contents. (C) Time activity curves based on ROI analysis of dynamic PET images.
