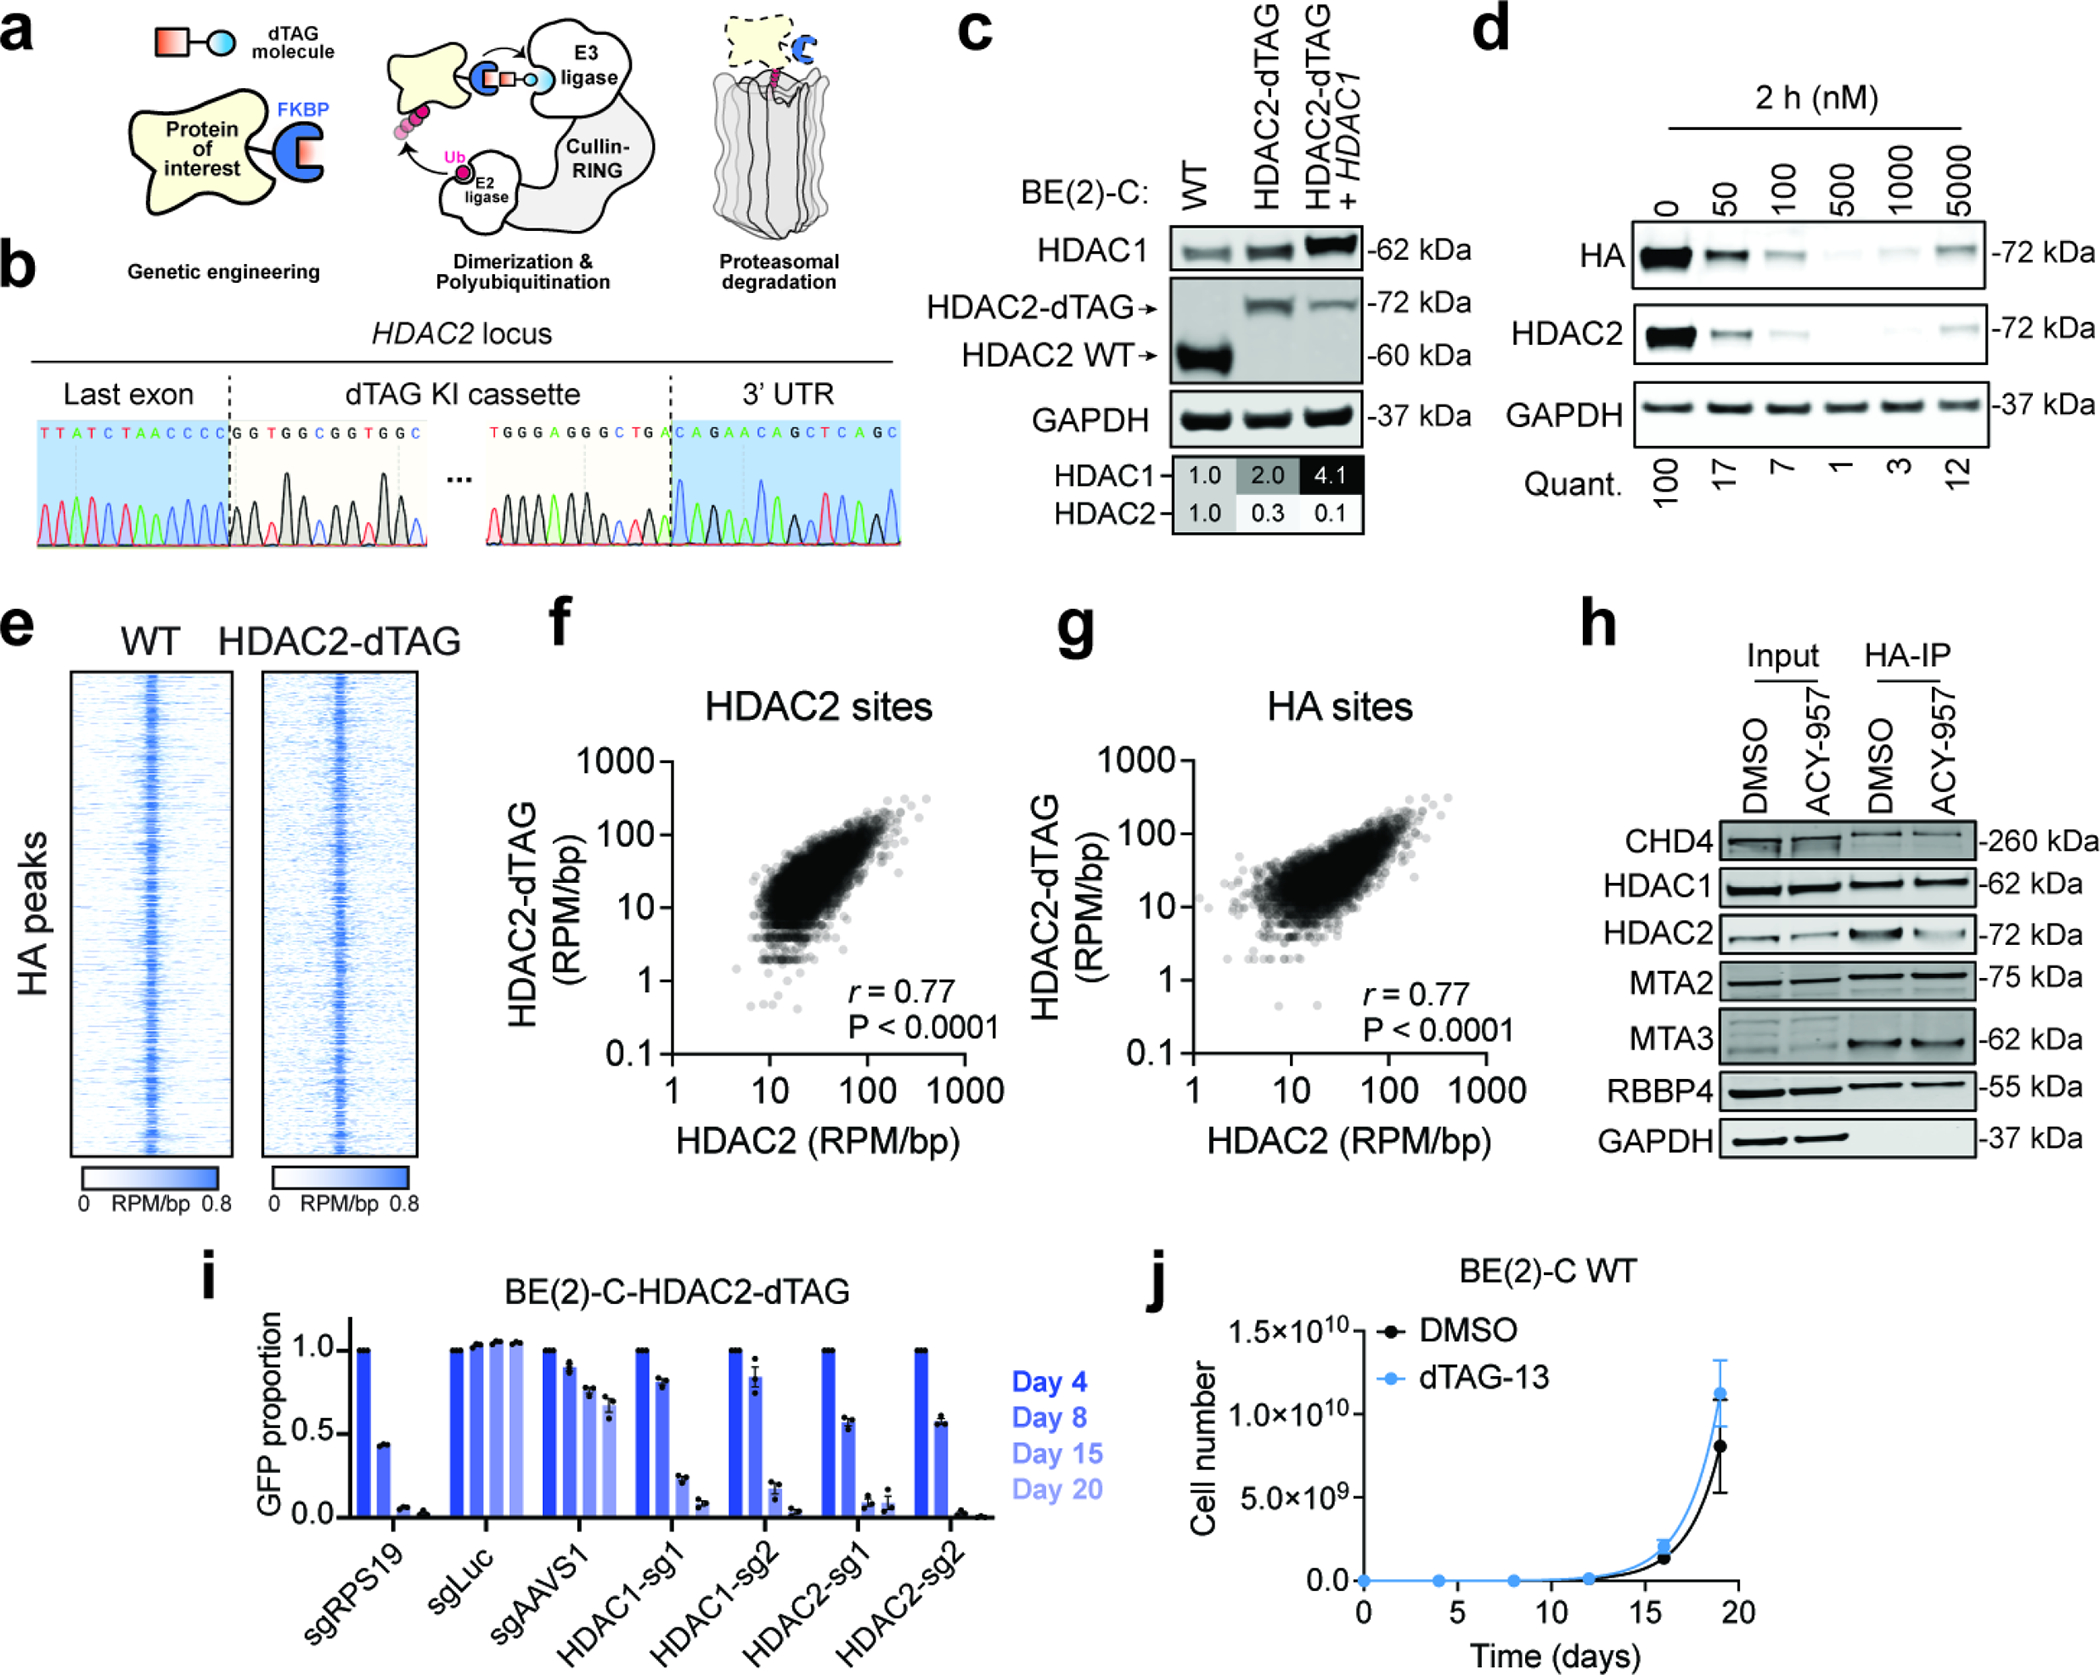
Extended Data Fig. 5. dTAG system allows efficient degradation of HDAC2 without affecting its normal functions.

a, Schematic illustration of the dTAG system. dTAG PROTACs mediate dimerization of the FKBP12F36A-tagged protein of interest and an E3 ubiquitin ligase, which results in ubiquitination and proteasomal degradation of the target protein. b, Representative Sanger sequencing chromatograms of HDAC2 locus of a clone with successful dTAG knock-in. c, Immunoblot validation of HDAC2-dTAG cell lines with and without HDAC1 overexpression. d, Dose response of dTAG-13 treatment in BE(2)-C-HDAC2-dTAG cells (2 h). e, Rank-ordered heatmaps of CUT&RUN signal for HDAC2 in wild-type BE(2)-C cells and HA in BE(2)-C-HDAC2-dTAG cells (ranked based on HA signal at HDAC2-HA binding sites in BE(2)-C-HDAC2-dTAG cells). f,g Correlations of HDAC2 CUT&RUN in BE(2)-C cells versus HA CUT&RUN in BE(2)-C-HDAC2-dTAG cells at HDAC2 binding sites in wild-type BE(2)-C cells (f) (n = 10,832) and at HDAC2-HA binding sites in BE(2)-C-HDAC2-dTAG cells (g) (n = 8,661). P values (two-tailed) were determined by Pearson correlation coefficient (r). h, Co-immunoprecipitation of HDAC2-dTAG (IP: HA) and NuRD subunits. i, Competitive growth assay with HDAC1- or HDAC2-targeting guides in BE(2)-C-HDAC2-dTAG cells. Mean ± s.e.m., n = 3. j, Proliferation of BE(2)-C wild-type cells are not affected by dTAG-13 (500 nM) (blue) compared to the DMSO group (black). Mean ± s.e.m., n = 3.
