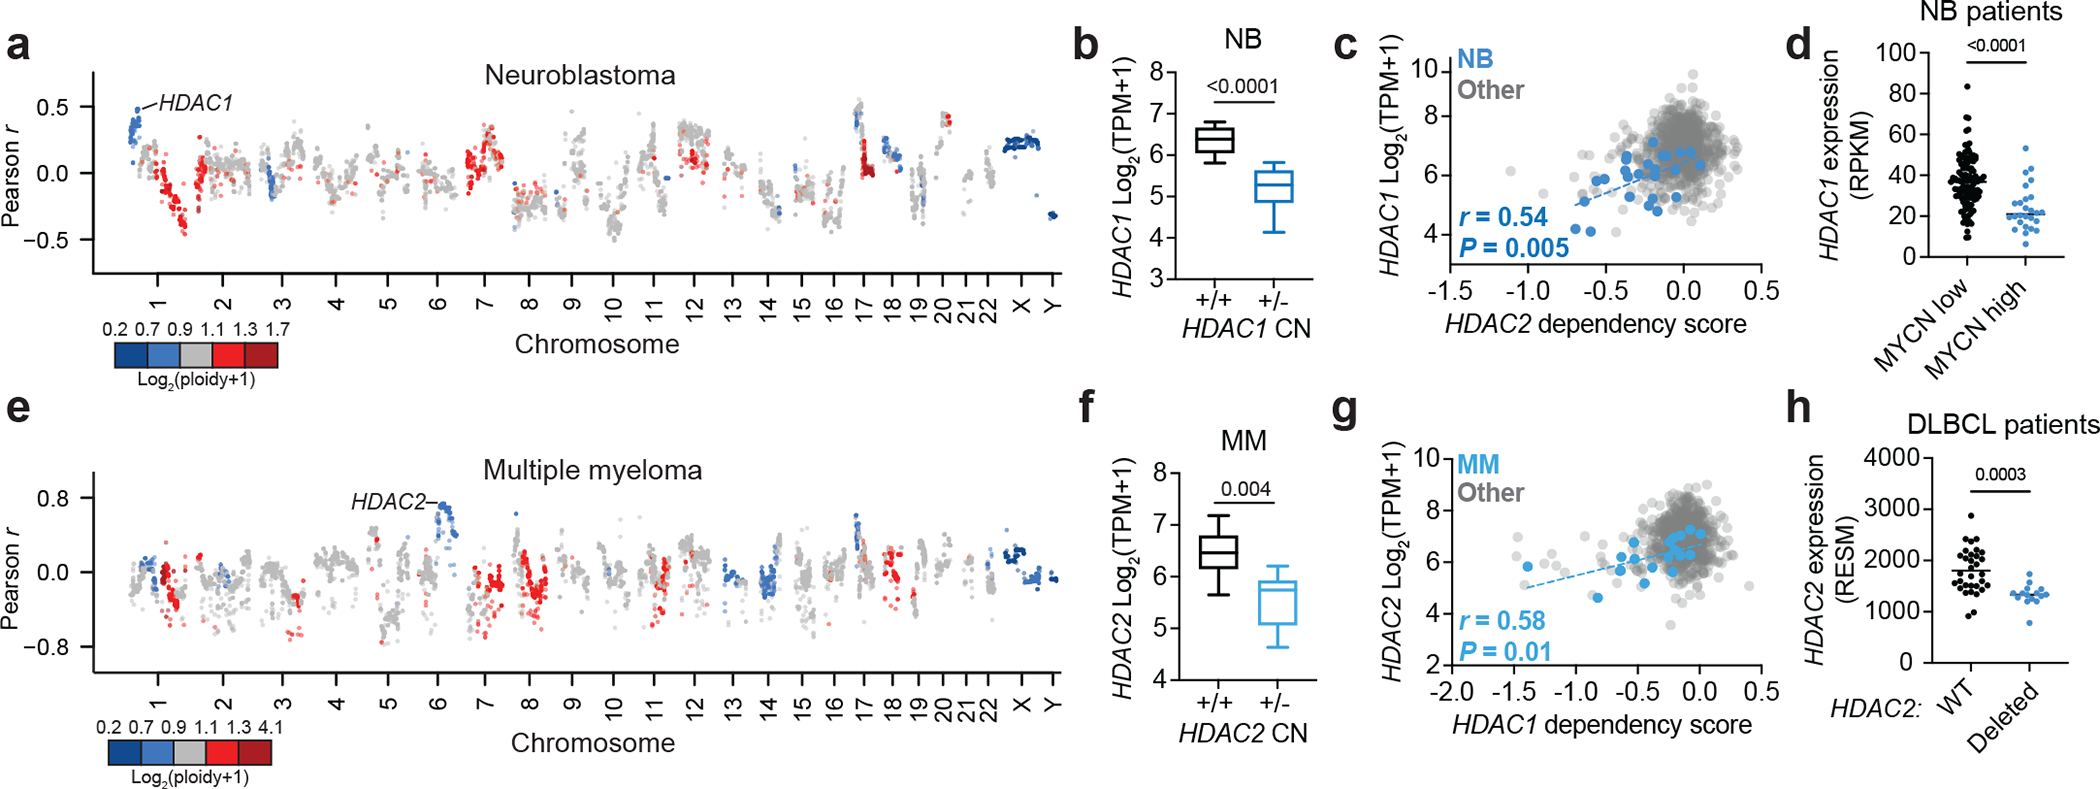
Figure 2: Collateral synthetic lethality between HDAC1 and HDAC2.

a, Correlations between gene copy number and HDAC2 dependency in neuroblastoma cell lines on DepMap (Pearson, n = 34 neuroblastoma cell lines). Points colored by average copy number in neuroblastoma cell lines. b, Boxplot of HDAC1 expression in neuroblastoma cell lines with (n = 12) and without (n = 19) HDAC1 deletion (see Methods for cutoff). c, Correlation of HDAC2 dependency versus HDAC1 expression in neuroblastoma cell lines and other lineages (n = 973). P value (two-tailed) was determined by Pearson correlation coefficient (r). d, HDAC1 expression in neuroblastoma patient sample with low MYCN expression (black, n = 115) and high MYCN expression (black, n = 26) (cutoff: RPKM < 90) (see Methods for data accessibility). e, Correlation between gene copy number and HDAC1 dependency in multiple myeloma (n = 21). f, Boxplot of HDAC2 expression in multiple myeloma lines with (n = 10) and without (n = 20) HDAC2 deletion (see Methods for cutoff). g, HDAC1 dependency versus HDAC2 expression in multiple myeloma and other lineages (n = 973). P value (two-tailed) was determined by Pearson correlation coefficient (r). h, HDAC2 expression in DLBCL patients with wild-type HDAC2 (black, n = 32) and HDAC2 loss (blue, n = 15) (see Methods for data accessibility). Unless specified, P values were determined by two-tailed Student’s t-test. Boxplots represent 25–75 percentiles with whiskers extending to 10–90 percentiles and the center line represents the median of the data.
