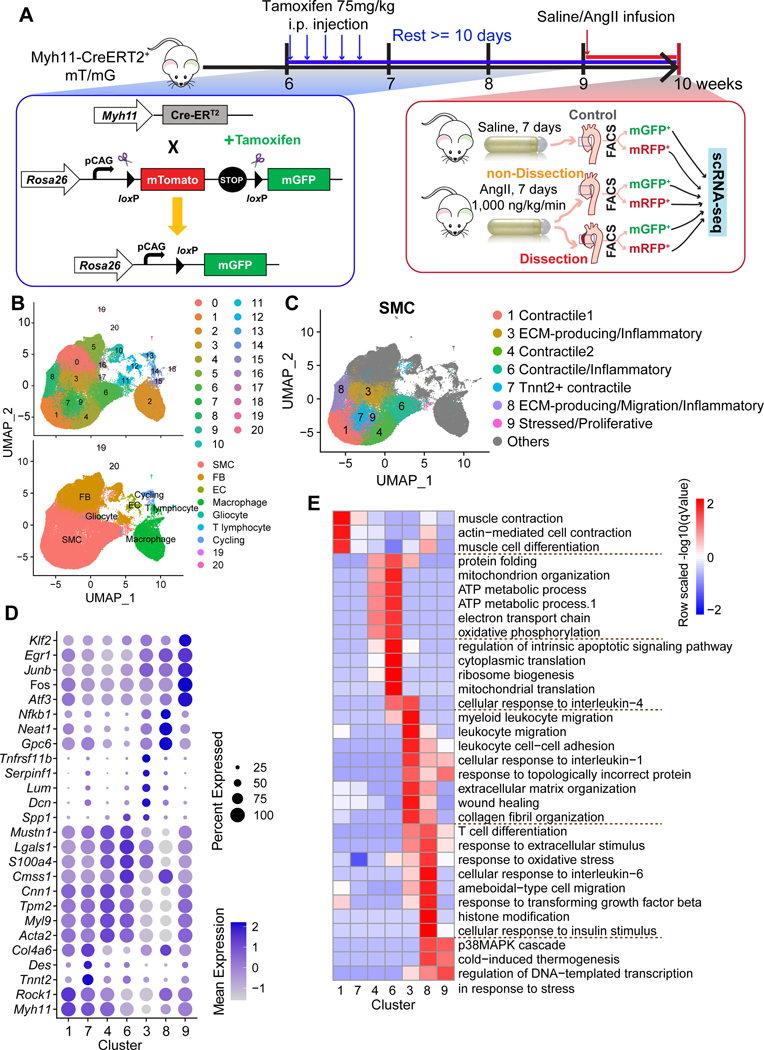
Figure 1. Single-cell analysis reveals the heterogeneity of cell populations in the aortic wall of SMC lineage-tracing mice.
A, Workflow for obtaining single-cell RNA-sequencing (scRNA-seq) data from Myh11-creERT2+ mT/mG lineage-tracing mice infused with saline (control mice) or angiotensin II (AngII-infused mice). The aortas were classified as control, non-dissection, and dissection. The cells were separated into GFP+ cells and RFP+ cells by flow cytometry. B, Two-dimensional uniform manifold approximation and projection (UMAP) plots showing all cells colored according to the identified 21 clusters. C, UMAP plot showing the subclusters of SMCs. A total of 7 clusters were identified. All other types of cells were colored in gray. D, Dot plot representing the conserved genes. E, Gene ontology (GO) analysis of the conserved genes for SMC subclusters.

