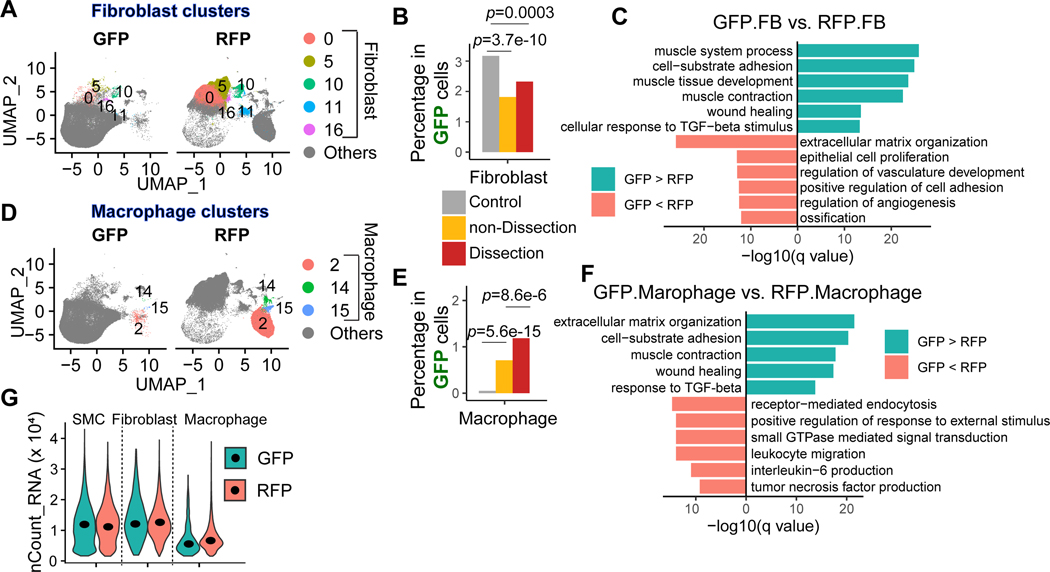
Figure 3. SMC lineage cells transformed to fibroblasts and macrophages.
A, Uniform manifold approximation and projection (UMAP) plots representing the fibroblast clusters in each sample. B, Proportion of fibroblasts in GFP+ cells in control, non-dissection, and dissection samples. C, A bar plot showing the top enriched biological process of significantly upregulated and downregulated genes in GFP+ fibroblasts compared with RFP+ fibroblasts. A one-tailed Fisher exact test was applied; all the mouse genes were set as background genes, and the p-value was adjusted by using the Benjamini-Hochberg method. The Fisher exact test was performed to compare the proportion between groups; the p values were adjusted by Bonferroni correction. D, Uniform manifold approximation and projection (UMAP) plots representing the macrophage clusters in each sample. E, Proportion of macrophages in GFP+ cells in control, non-dissection, and dissection samples. F, Bar plot showing the top enriched biological process of significantly upregulated and downregulated genes in GFP+ macrophages compared with RFP+ macrophages. A one-tailed Fisher exact test was applied; all the mouse genes were set as background genes, and the p-value was adjusted by using the Benjamini-Hochberg method. G, A violin plot showing the distribution of counts of RNA per cell in SMCs, fibroblasts, and macrophages that were GFP+ or RFP+.

