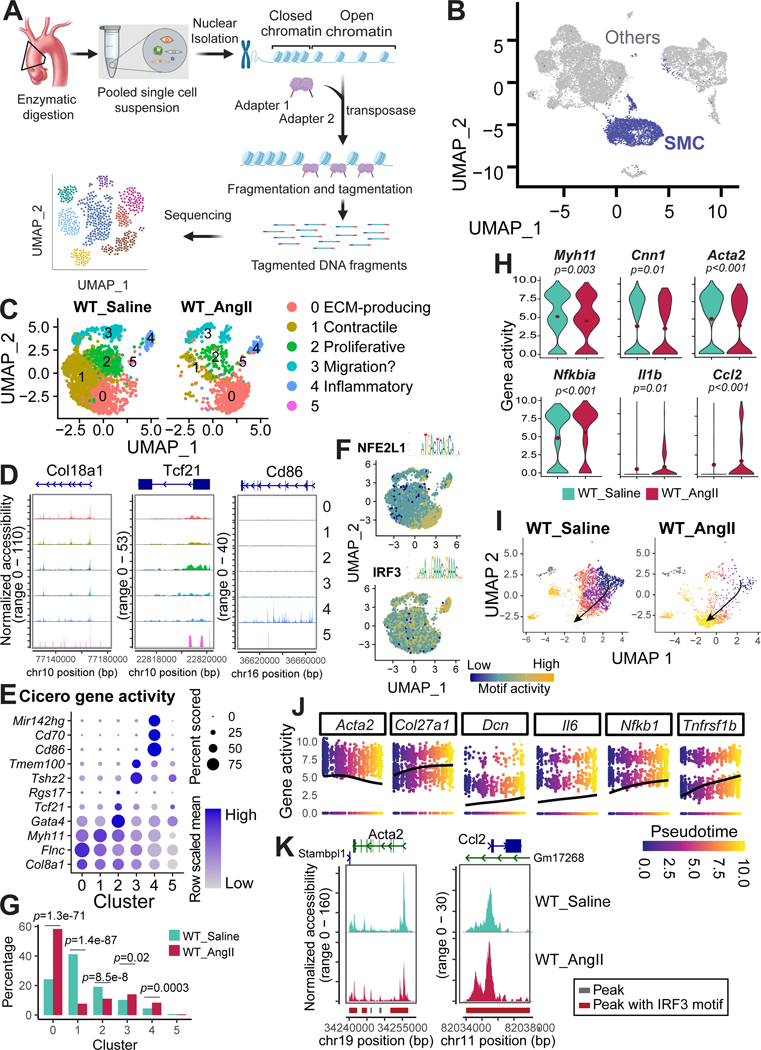
Figure 4. Decreased chromatin accessibility in contractile genes and increased chromatin accessibility in inflammatory genes in aortic smooth muscle cells (SMCs) of angiotensin II (AngII)-infused mice.
A, Workflow for obtaining and analyzing single-cell sequencing assay for transposase-accessible chromatin (scATAC-seq) data from the aortic tissues of saline-infused wild-type (WT) mice infused with saline or AngII-infused WT mice. B, Uniform manifold approximation and projection (UMAP) plot showing the SMCs identified from the scATAC-seq data. C, UMAP plot showing the SMC clusters identified by re-clustering all the SMCs. D, Chromatin accessibility of at locus of several marker genes in each SMC clusters. E, Dot plot of gene activity. The activity of genes was calculated by Cicero, and genes that were identified as markers by their activity are presented in the dot plot. F, Feature plot showing the motif activity of NFE2L1 and IRF3. G, Bar plot representing the percentage of different clusters in AngII-infused WT mice versus saline-infused WT mice. The Fisher exact test was performed to examine differences in the cluster proportion between groups; the p values were adjusted by Bonferroni correction. H, Violin plots showing the expression of contractile genes and inflammatory genes in control versus AngII-infused mice. I-J, Trajectory analysis illustrating the SMC transition from well-differentiated contractile SMCs in saline-infused mice to de-differentiated SMCs in AngII-infused mice. K, scATAC-seq analysis showing accessibility and peaks detected at the chromatin regions of a selected contractile gene (Acta2, left panel) and of a selected inflammatory gene (Ccl2, right panel). Peaks harboring Irf3 motifs were highlighted in red. Accessibility was shown for SMCs under different conditions.

