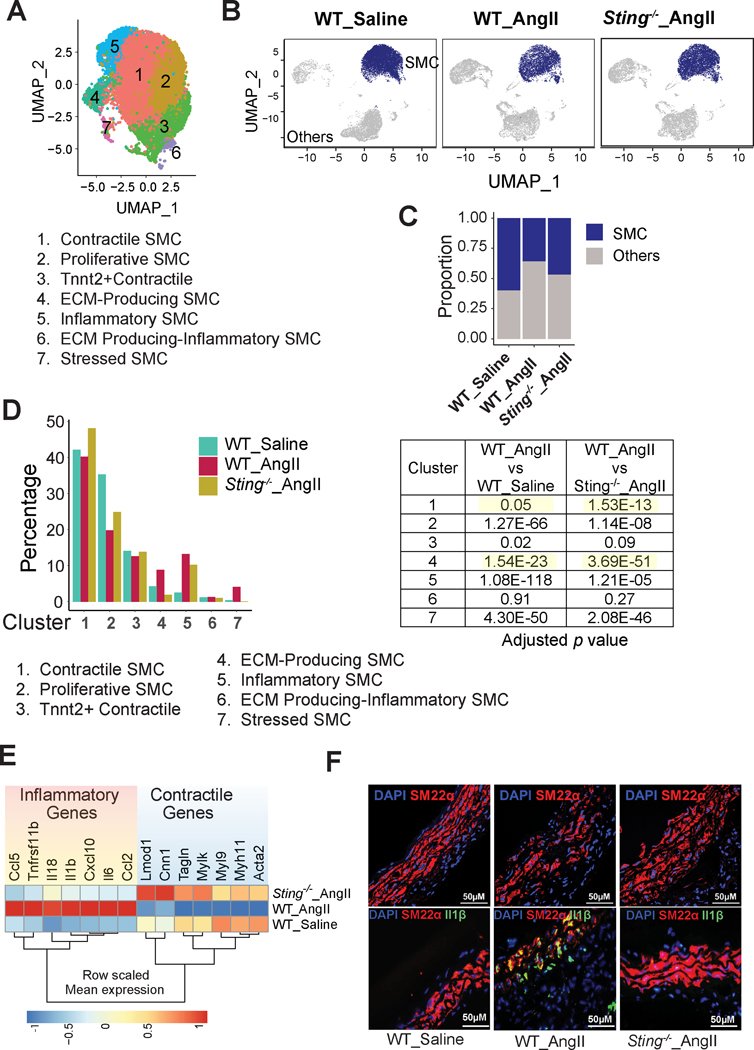
Figure 7. Reduced aortic smooth muscle cell (SMC) phenotypic alterations in Sting-deficient mice.
A, Uniform manifold approximation and projection (UMAP) plot representing the distribution of SMC subclusters. A total of 7 clusters were identified. B, UMAP showing a significant reduction in the size of the SMC population in angiotensin II (AngII)-infused wild-type (WT) mice that was partially prevented in AngII-infused Sting−/− mice. C, The proportion of SMC clusters in AngII-infused Sting−/− and in saline-infused mice. D, Bar diagram showing the percentage of the cluster population in aortic SMCs of the three different groups of mice. The Fisher exact test was performed to examine differences in the cluster proportion between groups. E, Heatmap representing the differential gene expression of contractile genes and inflammatory genes in aortic SMCs of the three different groups of mice. F, Immunofluorescence staining showing Sm22α and Il-1β expression in different groups of mice.

