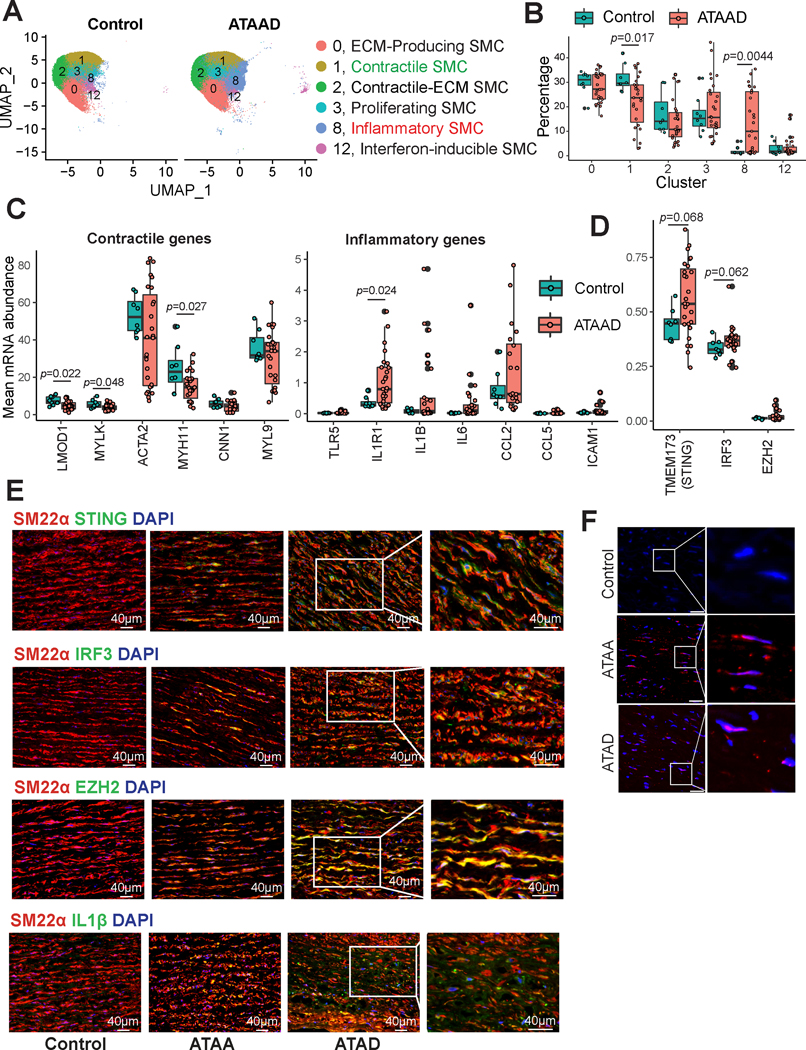
Figure 8. Single-cell RNA sequencing (scRNA-seq) analysis of human ascending thoracic aortic aneurysm and dissection (ATAAD) tissue revealing smooth muscle cell (SMC) phenotypic switching from a contractile to an inflammatory subtype.
A, Uniform manifold approximation and projection (UMAP) plot of SMC clusters identified from scRNA-seq analysis of patient ATAAD tissue and control tissue. B, Box plot representing the percent distribution of SMC clusters. The Wilcoxon rank sum test using the cluster percentage per sample was performed to compare the cluster proportion between ATAAD and control tissues. C, Boxplot showing the mean expression of contractile genes and inflammatory genes per sample in non-diseased controls versus patient ATAAD tissues. A Wilcoxon rank sum test using the mean expression value per sample per gene was performed to compare expression between ATAAD and control tissues. D, Boxplot showing the mean expression of STING, IRF3, and EZH2 per sample in non-diseased controls versus patient ATAAD tissues. A Wilcoxon rank sum test using the mean expression value per sample per gene was performed to compare expression between ATAAD and control tissues. E, Immunofluorescence staining showing SM22α, STING, IRF3 IL-1β, and EZH2 expression in patient ATAAD tissue versus non-diseased control tissue. F, Control, thoracic aortic aneurysm without dissection (ATAA), and acute ascending thoracic aortic dissection (ATAD) tissues were used to perform a proximity ligation assay followed by analysis by fluorescence microscopy. Scale bar, 40 μm.

