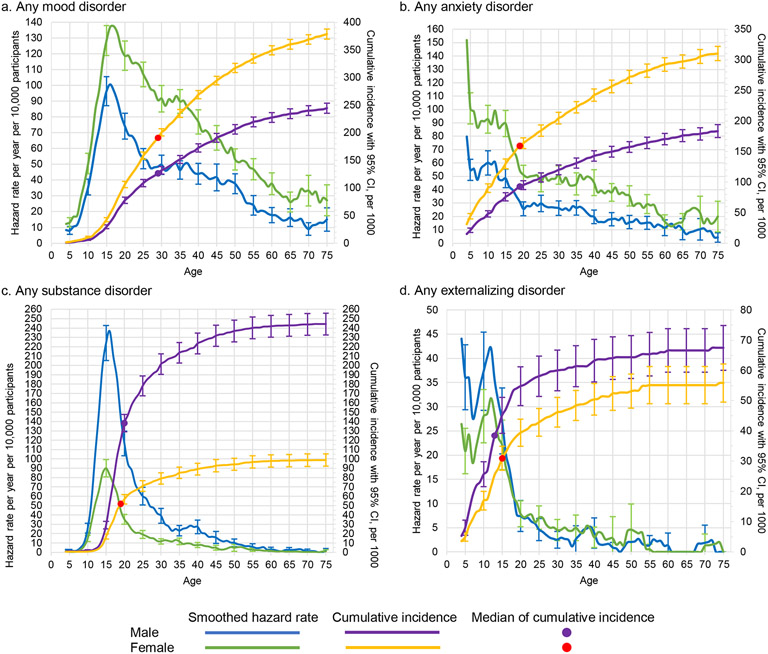
Figure 2: Smoothed hazard rates and cumulative incidence, with 95% confidence intervals by age and sex for any mood disorder, any anxiety disorder, any substance use disorder, and any externalizing disordera.
a Left y-axis curves, with blue for males and green for females, are hazard rate (incidence rate) curves. These are calculated per year of age per 10,000 people, defined as a ratio of the number of disorder onsets at a given age among people who never had the disorder at any time up to that age and who lived through that age. For a given age t we used information only from respondents in the age range t to t + 10 to minimize the effects of recall bias. Right y-axis curves, with purple for males and yellow for females, are cumulative incidence (or morbid risk) curves. These are calculated based on the age-specific incidence rates at each year of life using the standard exponential formula.14

