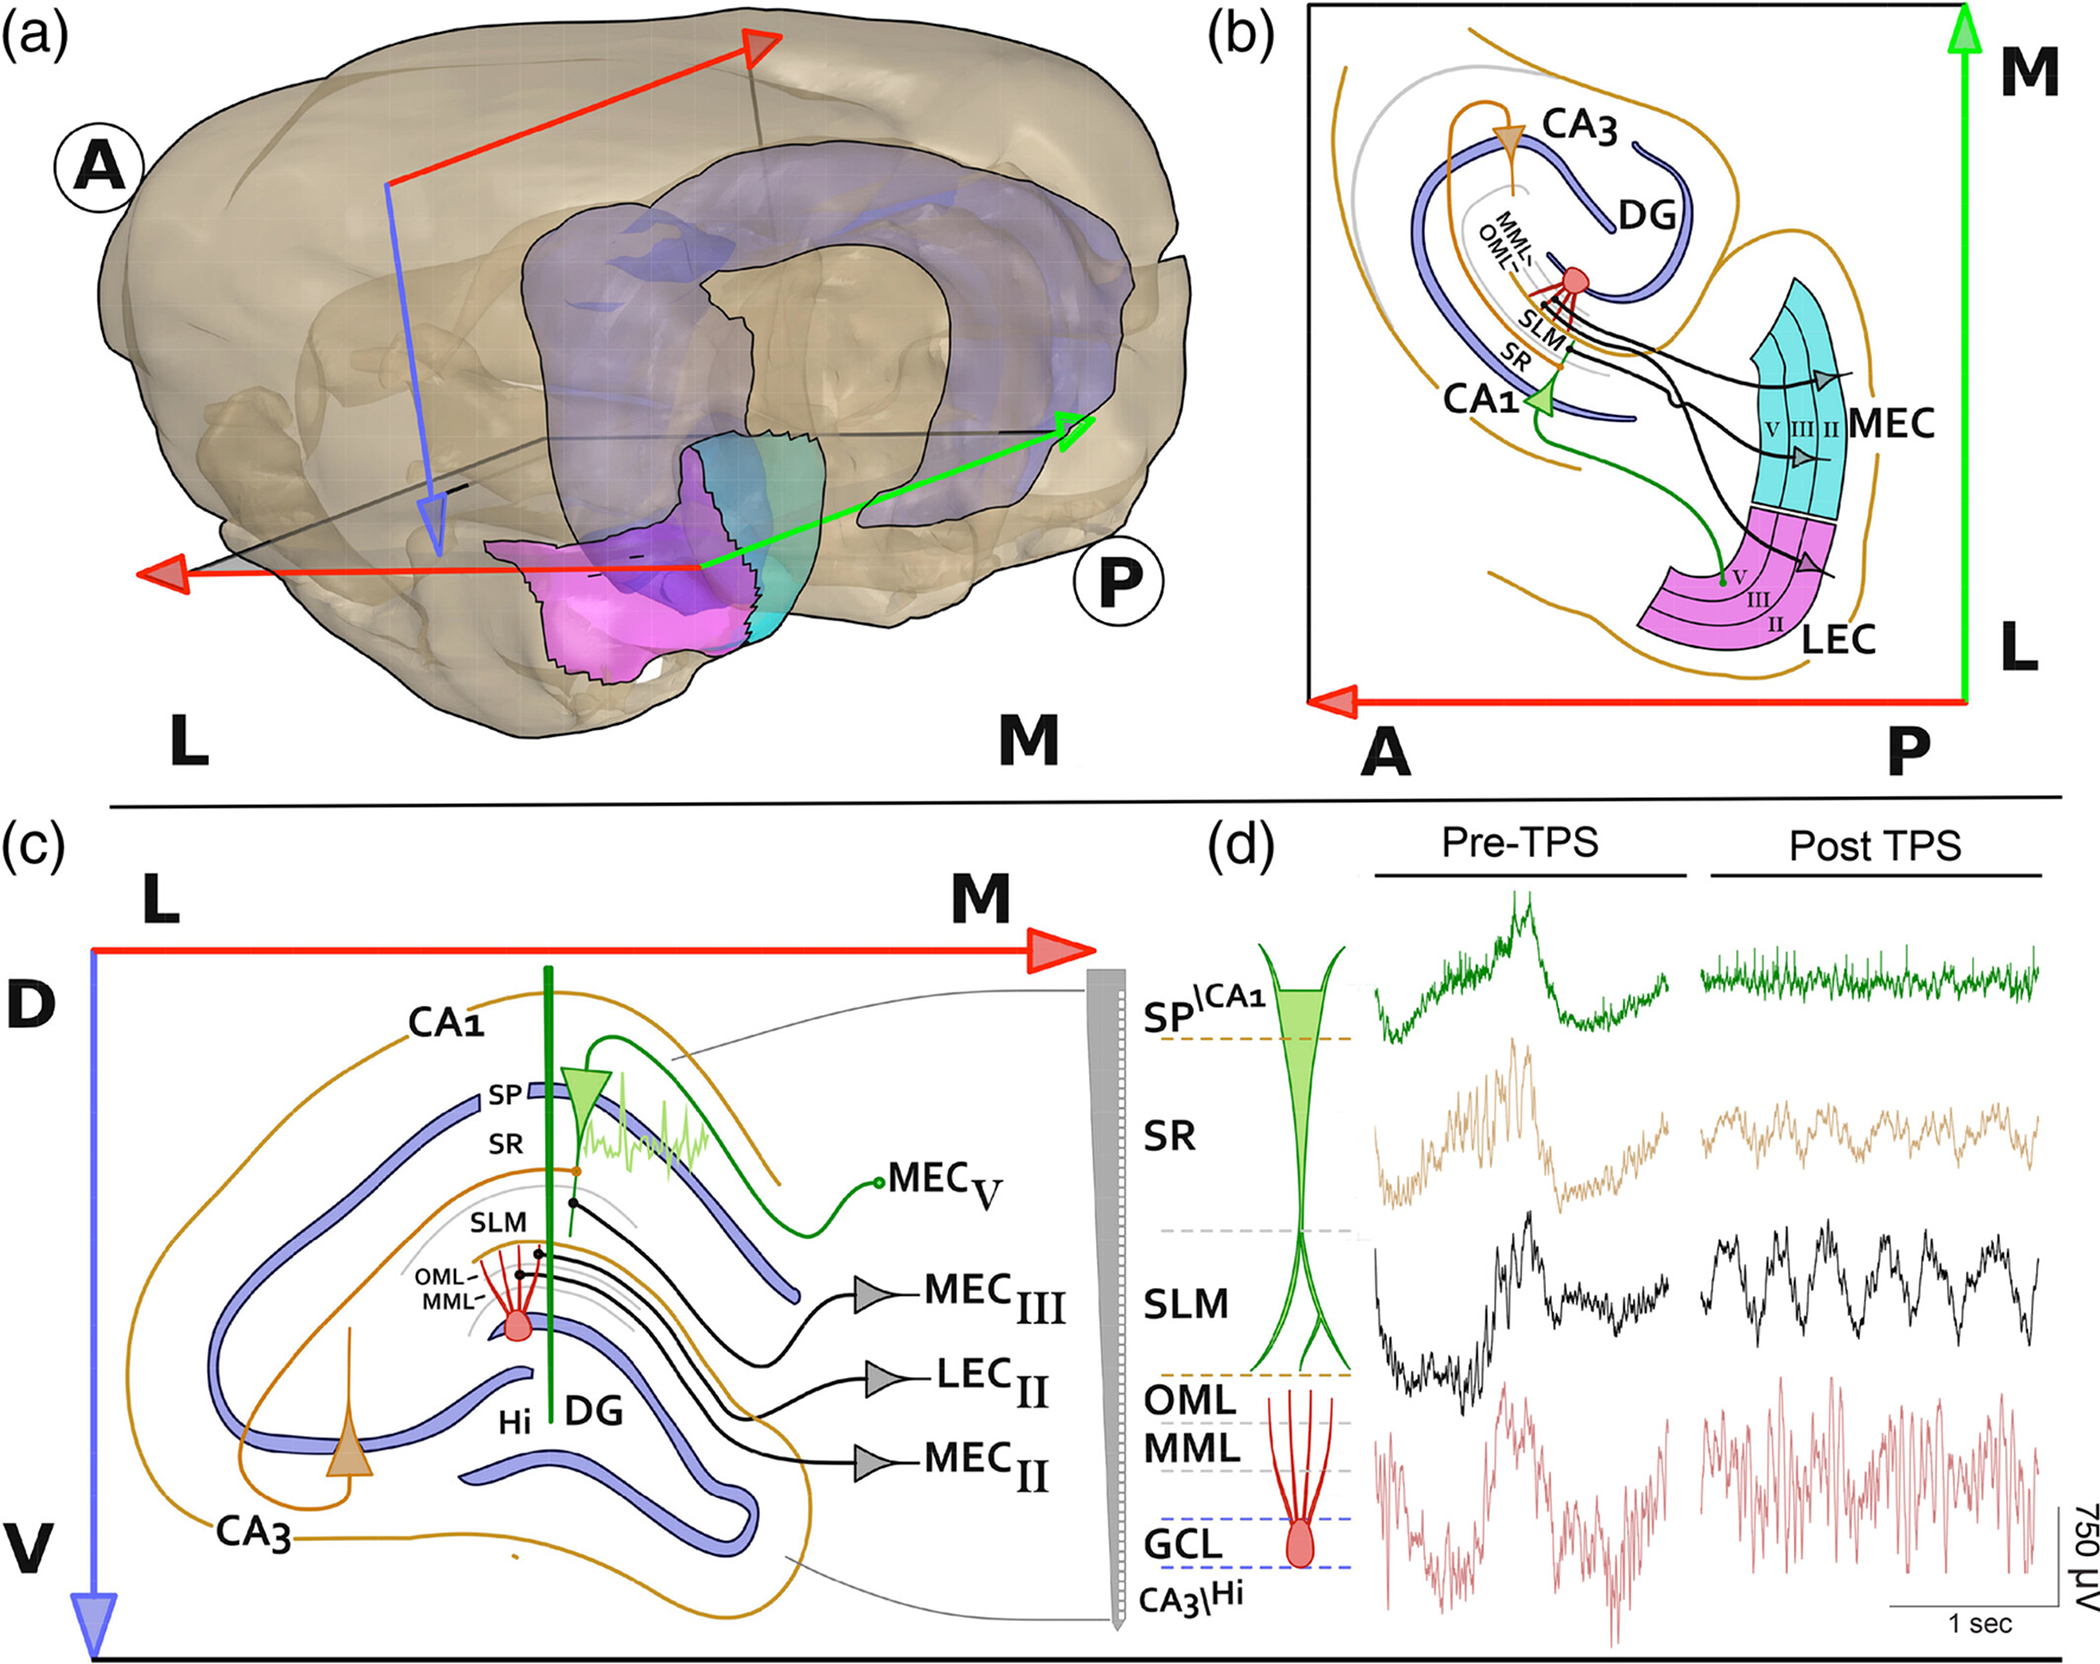
FIGURE 2.

Anatomy of the entorhinal-hippocampal spatial circuit. (a) Dorsal and ventral hippocampus (light blue) relative to the lateral (pink) and medial (aqua green) entorhinal cortex (LEC and MEC) in the coronal plane (red-blue arrows) and the horizontal plane (red-green arrows). Bold A and P denote Anterior and Posterior directions while Bold L and M denote Medial and Lateral directions; (b) horizontal cross section showing direct projections of L3 MEC to the tip of CA1 apical dendrites at stratum lacunosum-moleculare (SLM), L2 LEC and MEC projections to the outer molecular layer (OML) and medial molecular layer (MML) of the DG somatodendritic axis respectively. The circuit is complete when CA1/subiculum projects back to L5 of the MEC or LEC; (c) laminar organization of entorhinal-hippocampus projections from L3 MEC to CA1 at SLM, L2 LEC, and MEC to OML and MML of DG and position of a silicon probe (Green line). (d) The silicon probe allows for simultaneous interrogation of stratum pyramidale (SP) and DG cell layers as well as axonal projections from LEC and MEC during the transition from spontaneous oscillations to a regular ~3 Hz tail slow theta signal under urethane anesthesia. The high-resolution recording of this slow theta signal post-tail pinch allows for the assay of induced network-level input/output alterations along the somatodendritic axes and putative changes caused by eFSE.
