FIGURE 9.

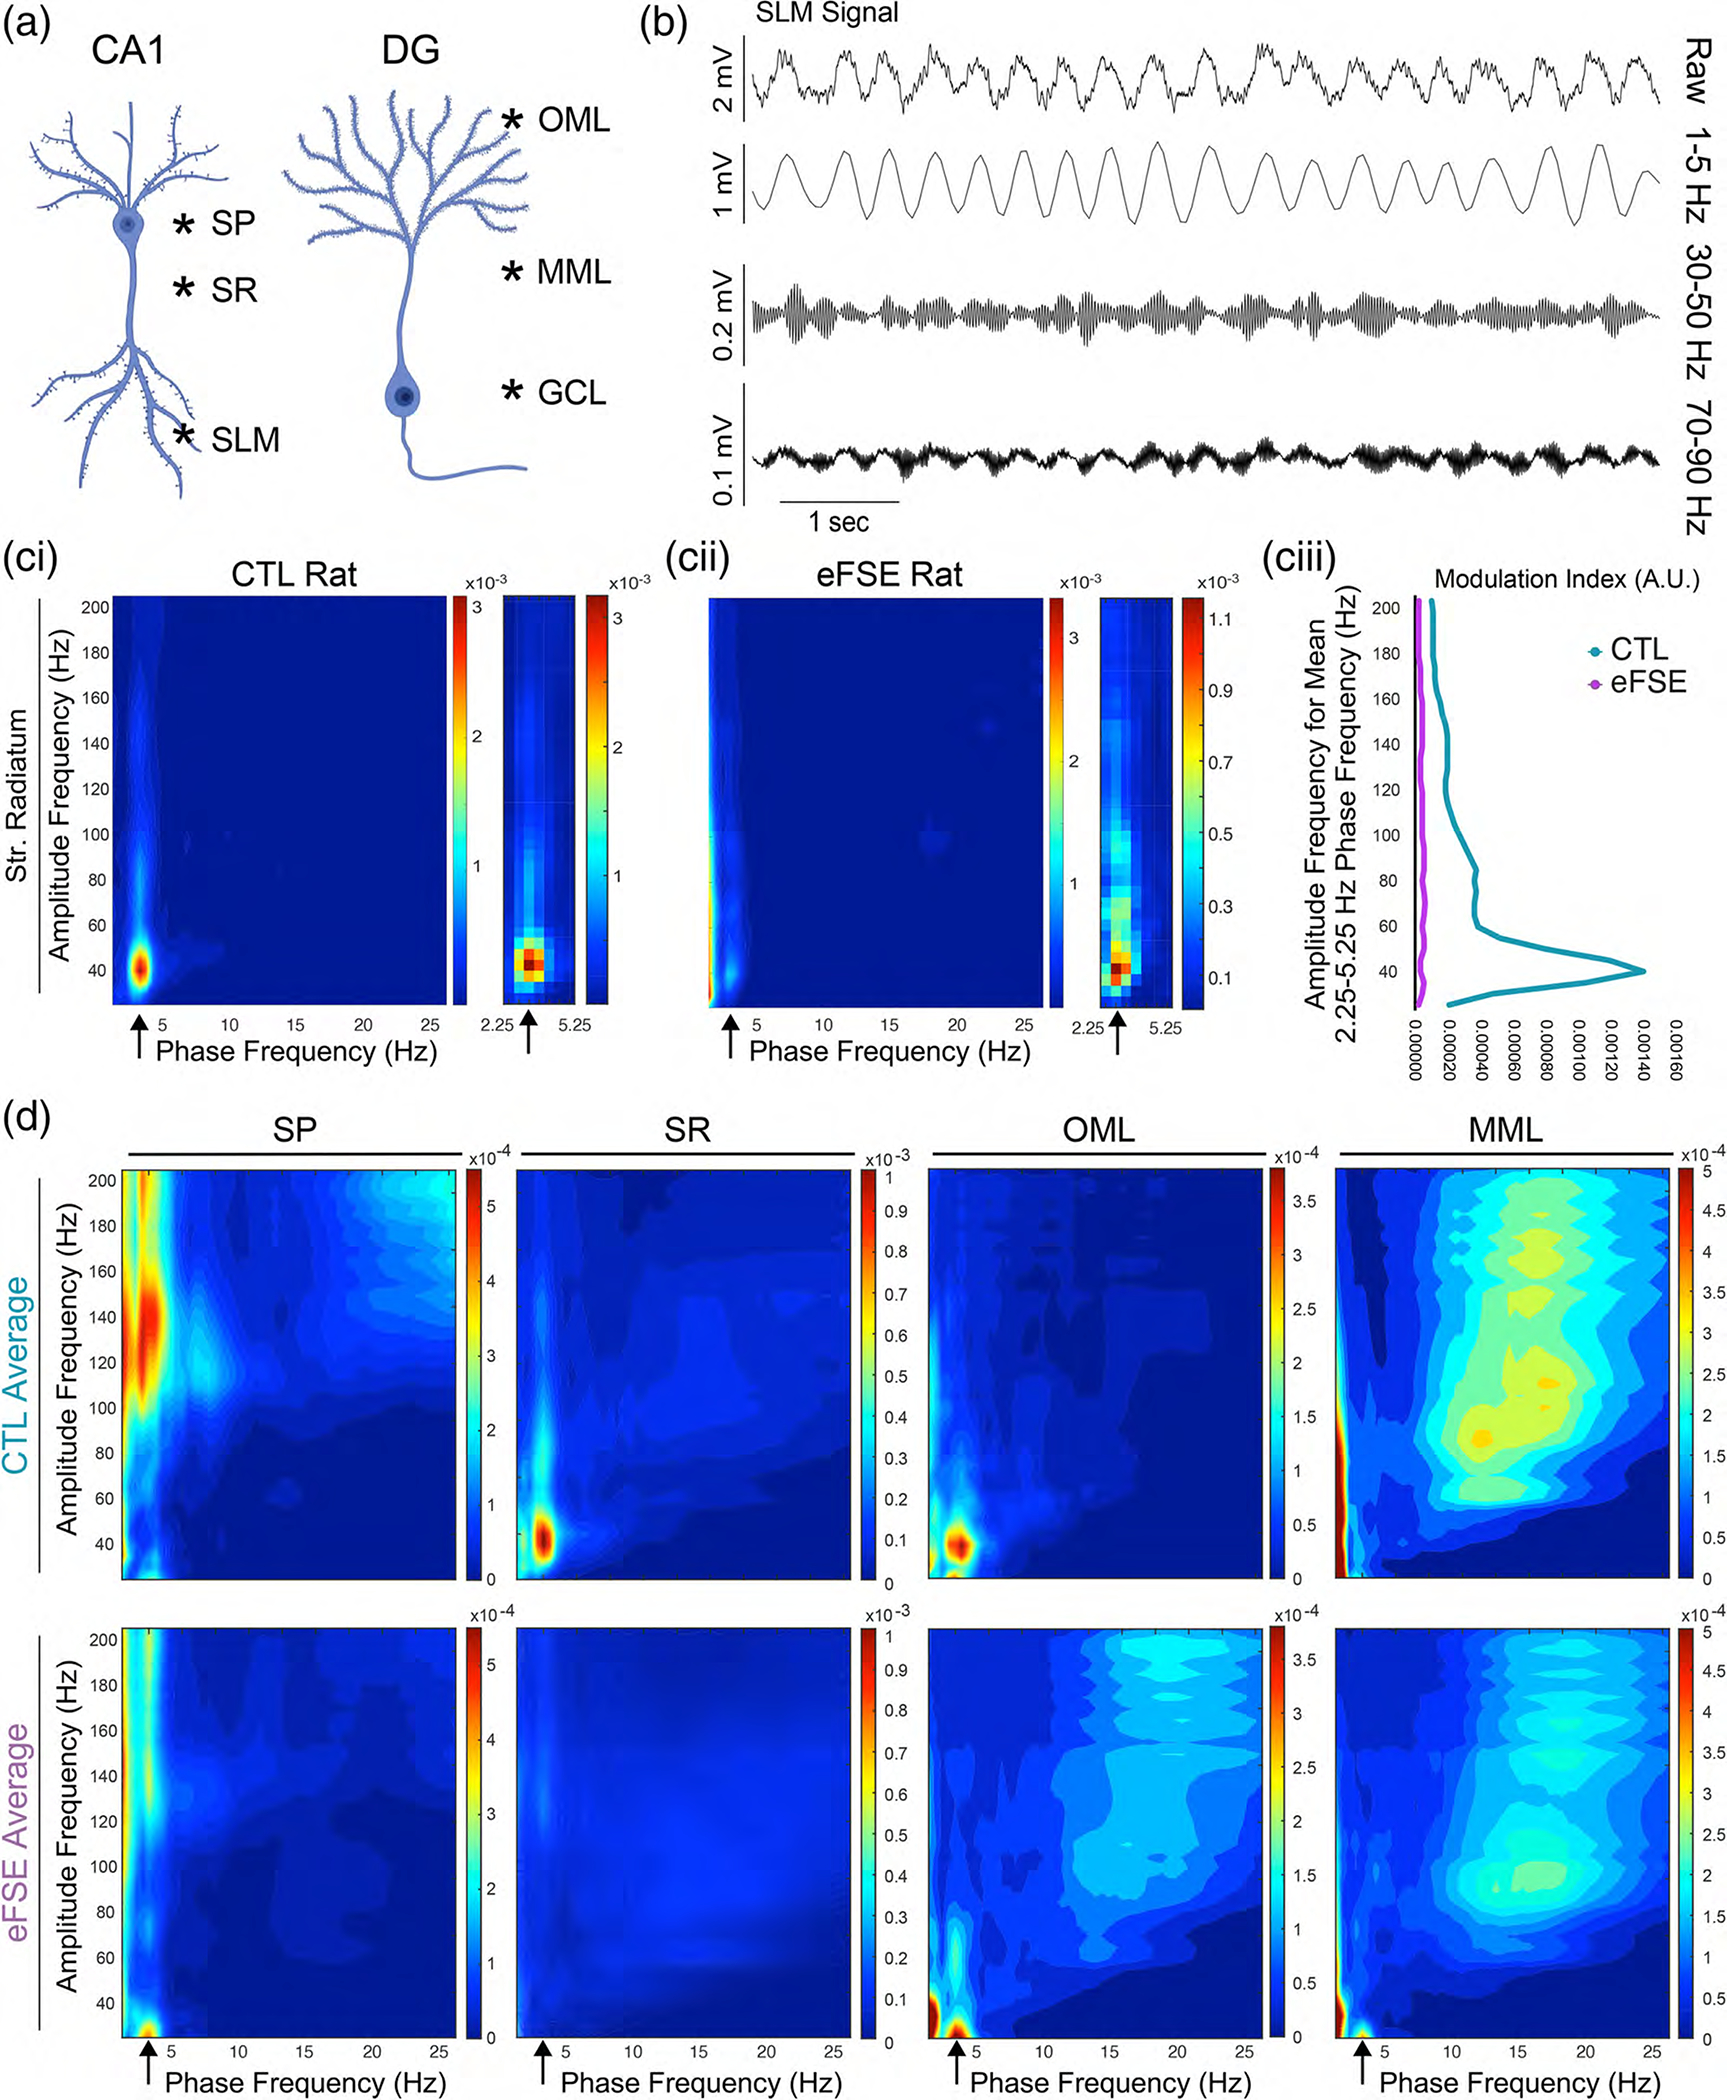
Cross frequency coupling on the CA1 and DG axes. (a) Regions of interest on the CA1 and DG somatodendritic axes sampled from each rat in each group. (b) Illustration of frequency dynamics from an unfiltered LFP in the SLM of a control animal following tail pinch, and the same signal filtered at 1–5 Hz, 30–50 Hz (slow gamma), and 70–90 Hz (medium gamma). (ci) Example comodulogram from a CTL rat at SR illustrates that the phase frequency stemming from the ~3 Hz TPS is strongly coupled to the amplitude-frequency at ~40 Hz. (cii) Although this slow gamma coupling is present in the eFSE example at SR, it is more diffuse and attenuated in comparison to the CTL example. (ciii) Plots of the mean modulation index of the 2.25–5.25 Hz phase frequency against the amplitude frequency indicating that slow theta and slow gamma coupling may be reduced in the eFSE animal. (d) Averaged modulation index of cross-frequency coupling across CTL (top) and eFSE (bottom) animals at SP, SR, OML, and MML. In CA1, eFSE animals exhibit reduced 3 Hz coupling with fast gamma at SP and slow gamma at SR and SLM. In DG, eFSE animals show less differentiation than CTL along the somatodendritic axis at OML and MML, with increased 3 Hz coupling at slower gamma frequencies.
