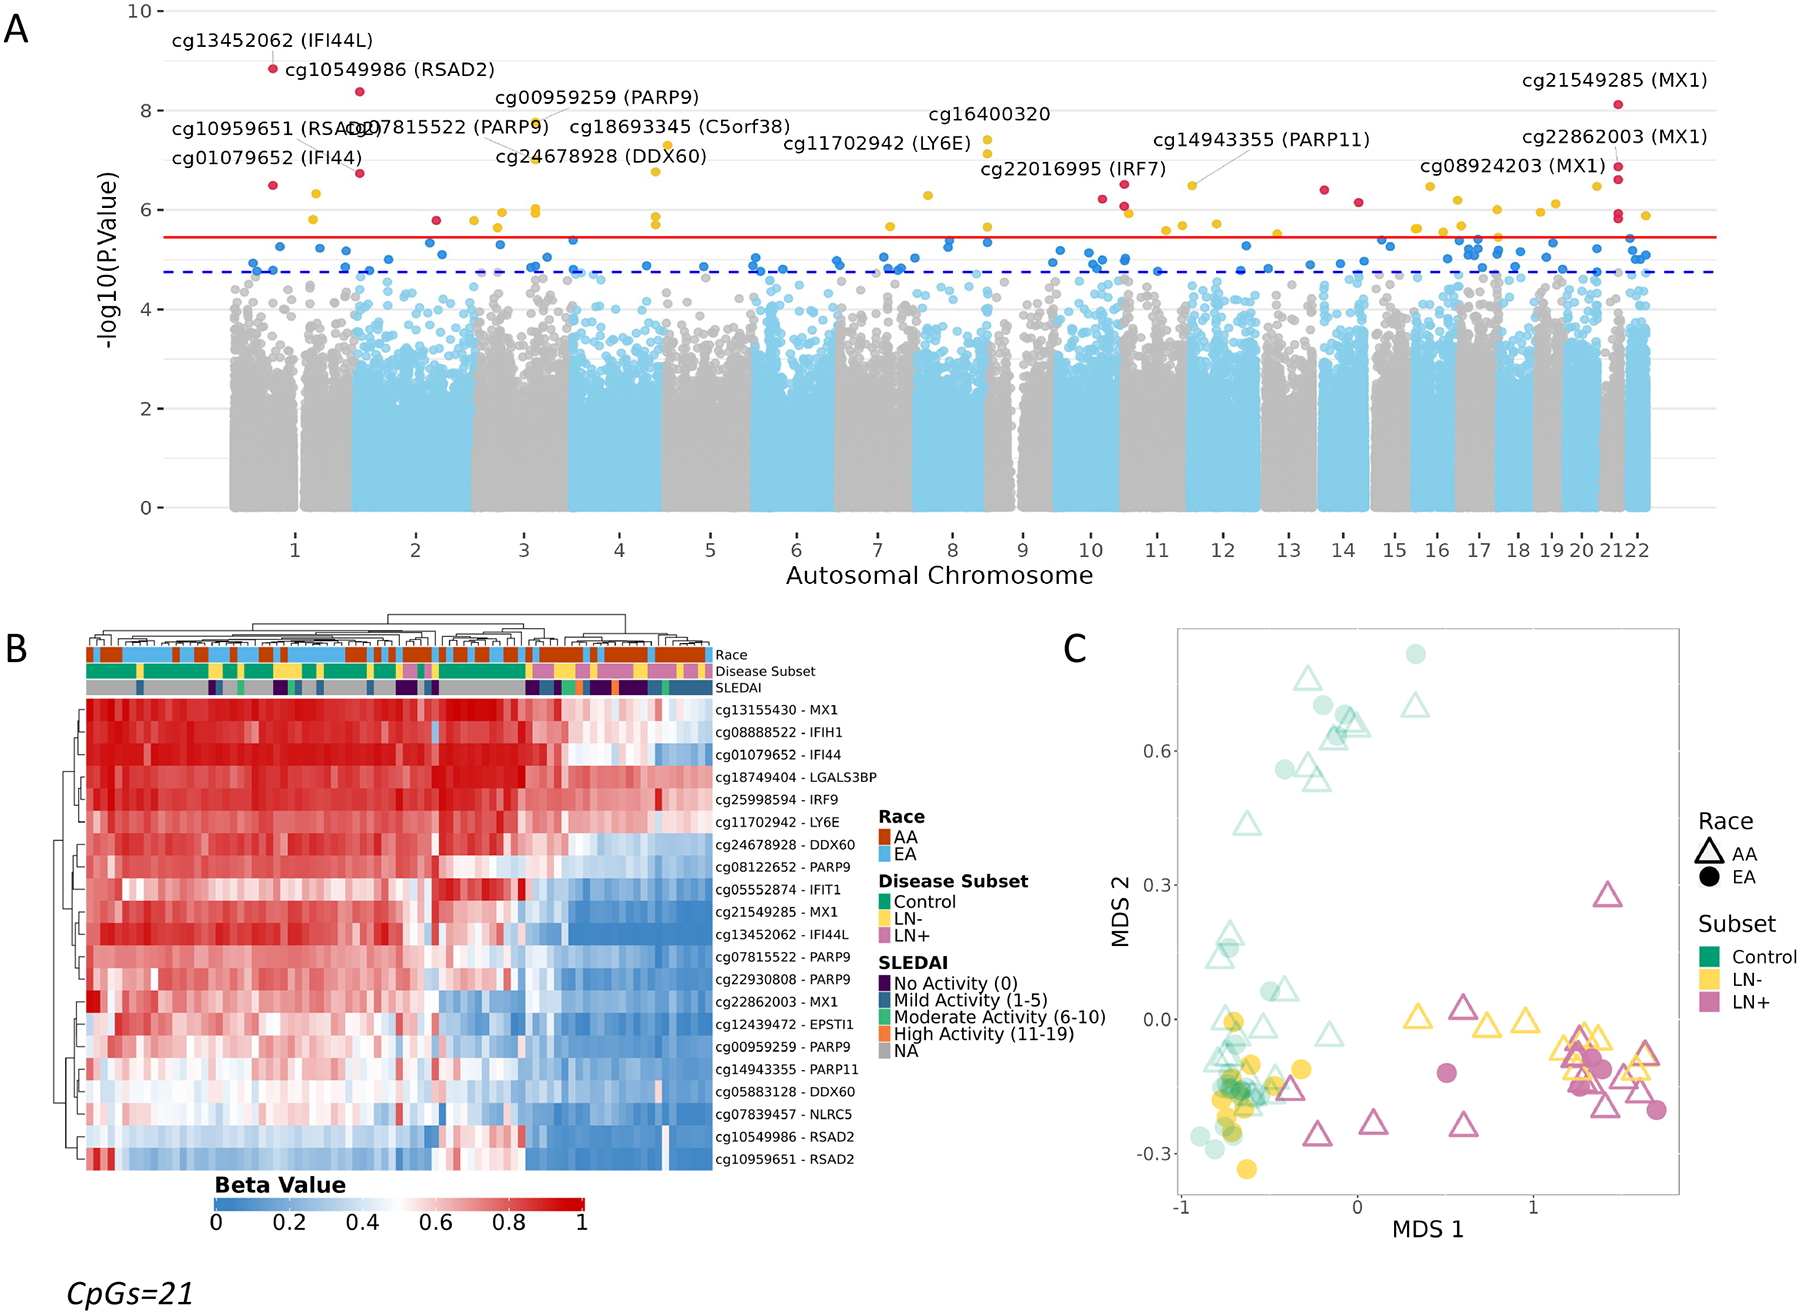
Fig 1.

DNA Methylation was assessed using the MethylationEPIC microarray on 87 buffy coat samples (46 controls and 41 SLE patients [20 SLE-LN+, 21 SLE-LN-]) A. Manhattan plot from the DNA Methylation Analysis. CpGs above the suggestive line (dotted blue) passed FDR<0.1. CpGs above the significance line (solid red) passed FDR<0.05. CpGs near interferon genes are highlighted in red. B. Unsupervised hierarchical cluster heatmap of beta values of CpGs (CpGs=21, false discovery rate < 0.05 & difference of 10% between cases and controls) significantly associated with Systemic Lupus Erythematosus. Each column represents an individual sample which is annotated by race (AA – Red, EA – Blue) and disease subset (Control, green; lupus without nephritis (LN-), yellow; lupus nephritis (LN+), pink) whereas each row represents a CpG with a color gradient based on their methylation status (Red – Methylated, Blue – Unmethylated). C. MDS Plot separates control and SLE samples, using the top SLE-associated CpGs. EA LN+ clusters with AA cases.
