
Figure 2.
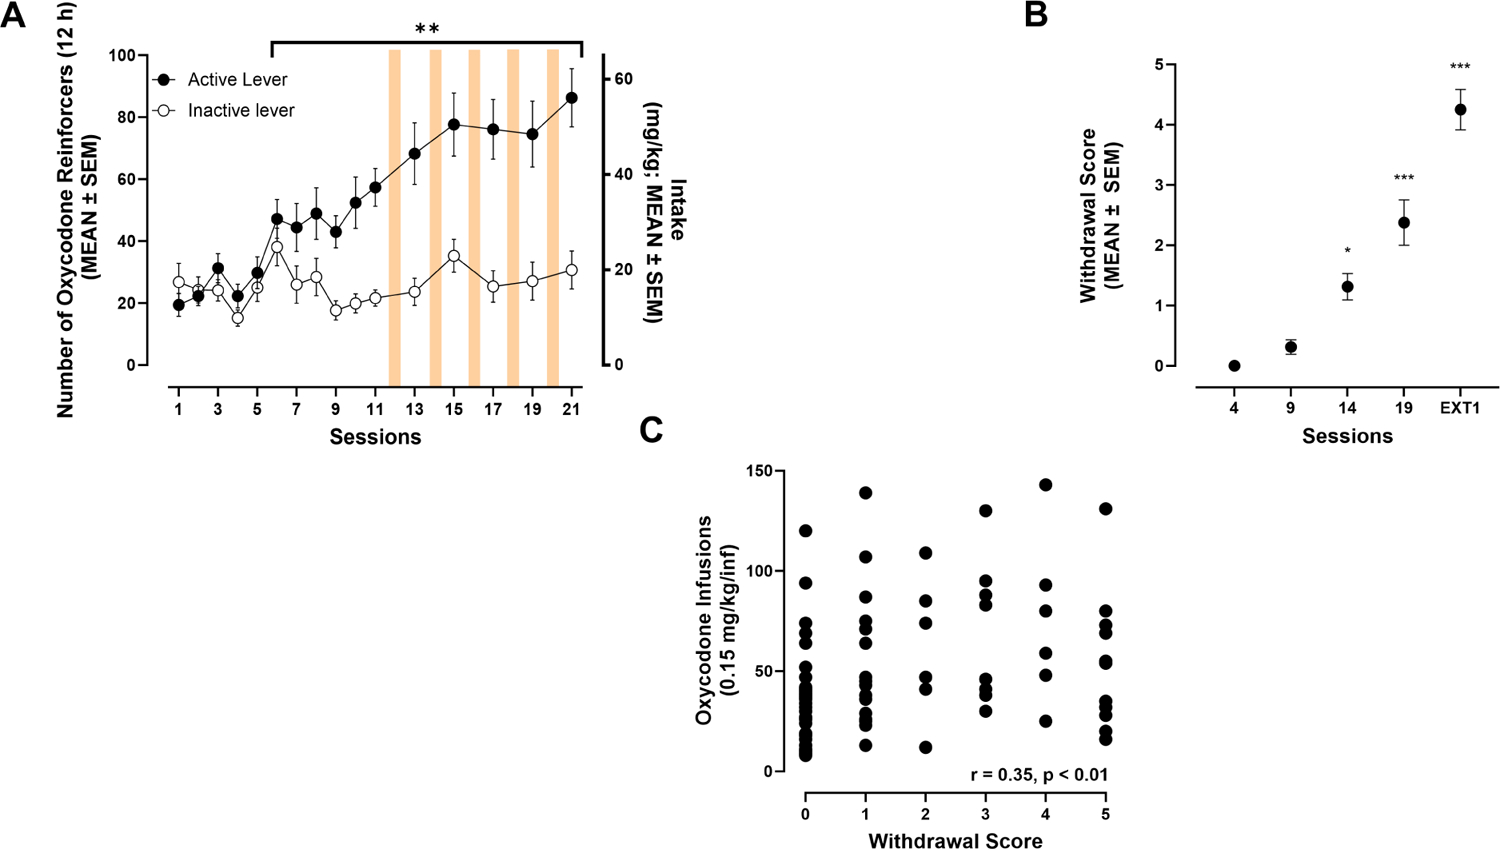
(A) Oxycodone self-administration over the 21 sessions (12 h/day; Bonferroni: **p ≤ 0.001, vs. session 1). (B) Somatic withdrawal symptoms across self-administration sessions (Dunn’s: *p ≤ 0.05, ***p ≤ 0.001, vs. session 4). (C) Correlation plot between the somatic withdrawal scores and the number of oxycodone infusions.