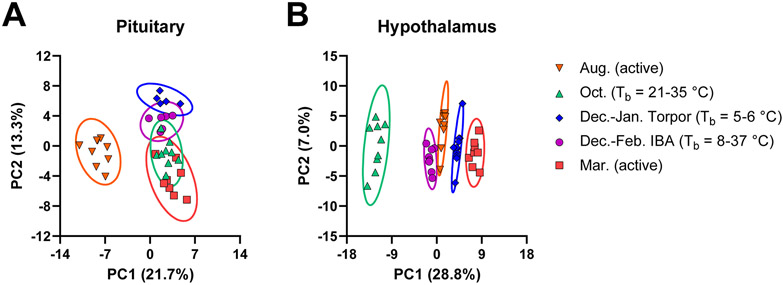
Figure 2.
Principle component analysis for LC-MS-measured peptide profile. PCA scores plots from the (A) pituitary and (B) hypothalamus after preprocessing and normalization by EigenMS. For the pituitary, n = 37 animals were analyzed from August (Aug., n = 9), October (Oct., n = 9), torpor (Dec.-Jan. Torpor, n = 5), IBA (Dec.-Feb. IBA, n = 6), and March (Mar., n = 8). For the hypothalamus, n = 45 animals were analyzed from August (Aug., n = 9), October (Oct., n = 9), torpor (Dec.-Jan. Torpor, n = 11), IBA (Dec.-Feb. IBA, n = 8), and March (Mar., n = 8).

