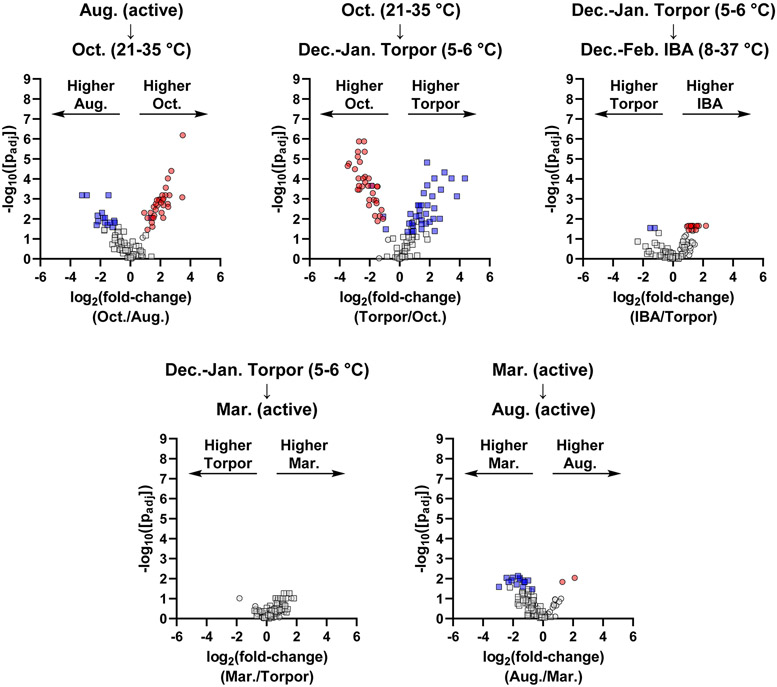
Figure 4.
Volcano plots representing pairwise comparisons for hypothalamus peptides for chronological transitions throughout the year. Circles represent prohormone-derived peptides, while squares indicate peptides arising from non-prohormone proteins. Red data points indicate significantly changing prohormone-derived peptides (passing both parametric and non-parametric tests with p < 0.05). Blue data points indicate significantly changing non-prohormone derived peptides. Grey data points indicate peptides that were not significantly changing (p > 0.05 in either or both tests).

