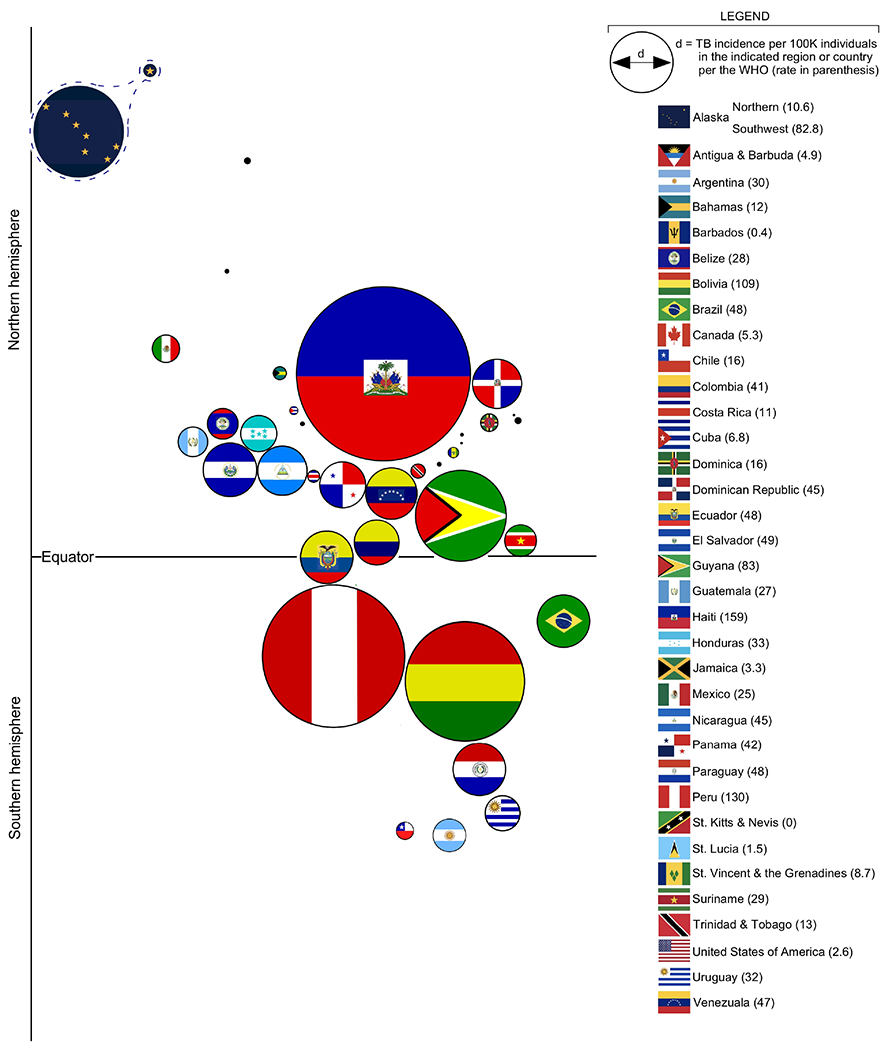
FIGURE 2. The TB incidence rate of Northern and Southwest Alaska relative to all countries in the Western Hemisphere.

Bubble chart depiction of TB incidence in each country of the Western Hemisphere, per 2021 data reported by the World Health Organization. The diameter of each bubble is directly proportional to TB incidence in the indicated country, each country being represented by its flag. Bubbles are generally organized according to the latitude and longitude coordinates of the corresponding country’s capital city. For comparison purposes, the incidence rates of Northern and Southwest Alaska--the bubble for which are represented by Alaska flag components--are treated separately from all other US states. Note that any country with an incidence of 5/100K or below is depicted by a black dot.
