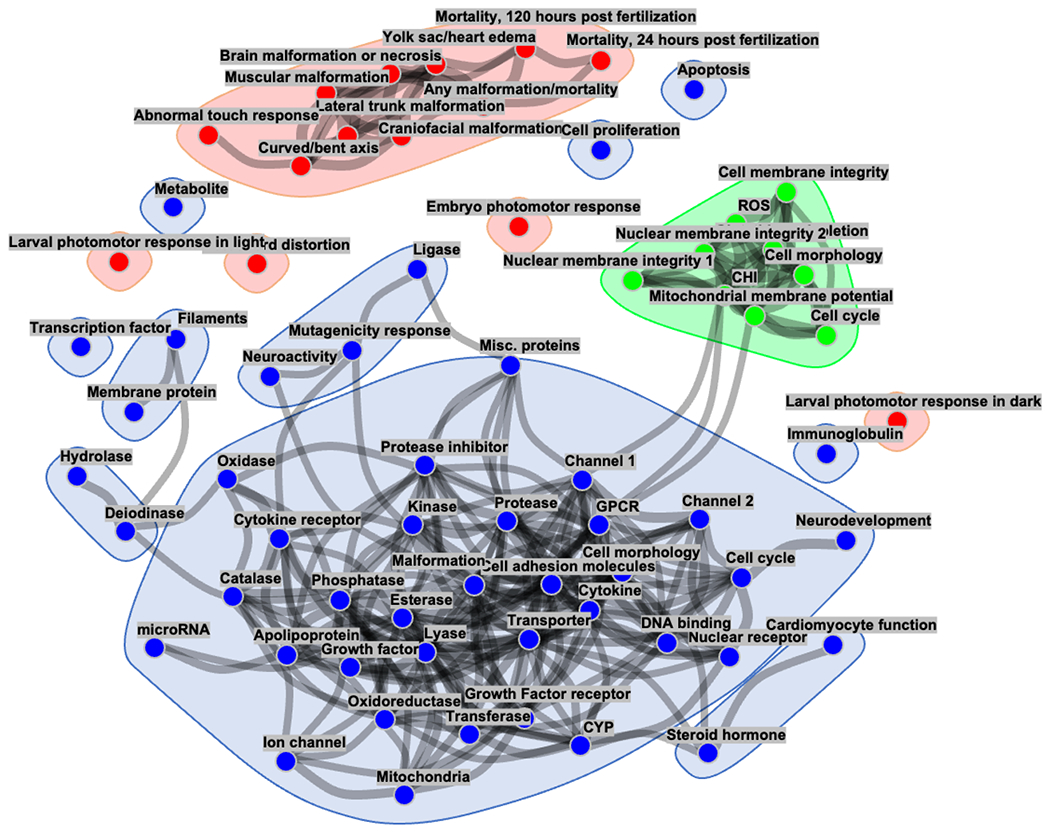
Figure 4. Correlation network representation of assay endpoints from CHS, ZBEscreen™, and the EPA’s CompTOX dashboard.

Correlation analyses and clustering of the network vertices showed the formation of distinct groups of assay endpoints. Blue points are assay endpoints curated within CompTOX, red and green points represent endpoint readouts from the ZBEscreen™ and CHS, respectively. The edges indicating correlations with absolute value less than 0.5 are not shown.
