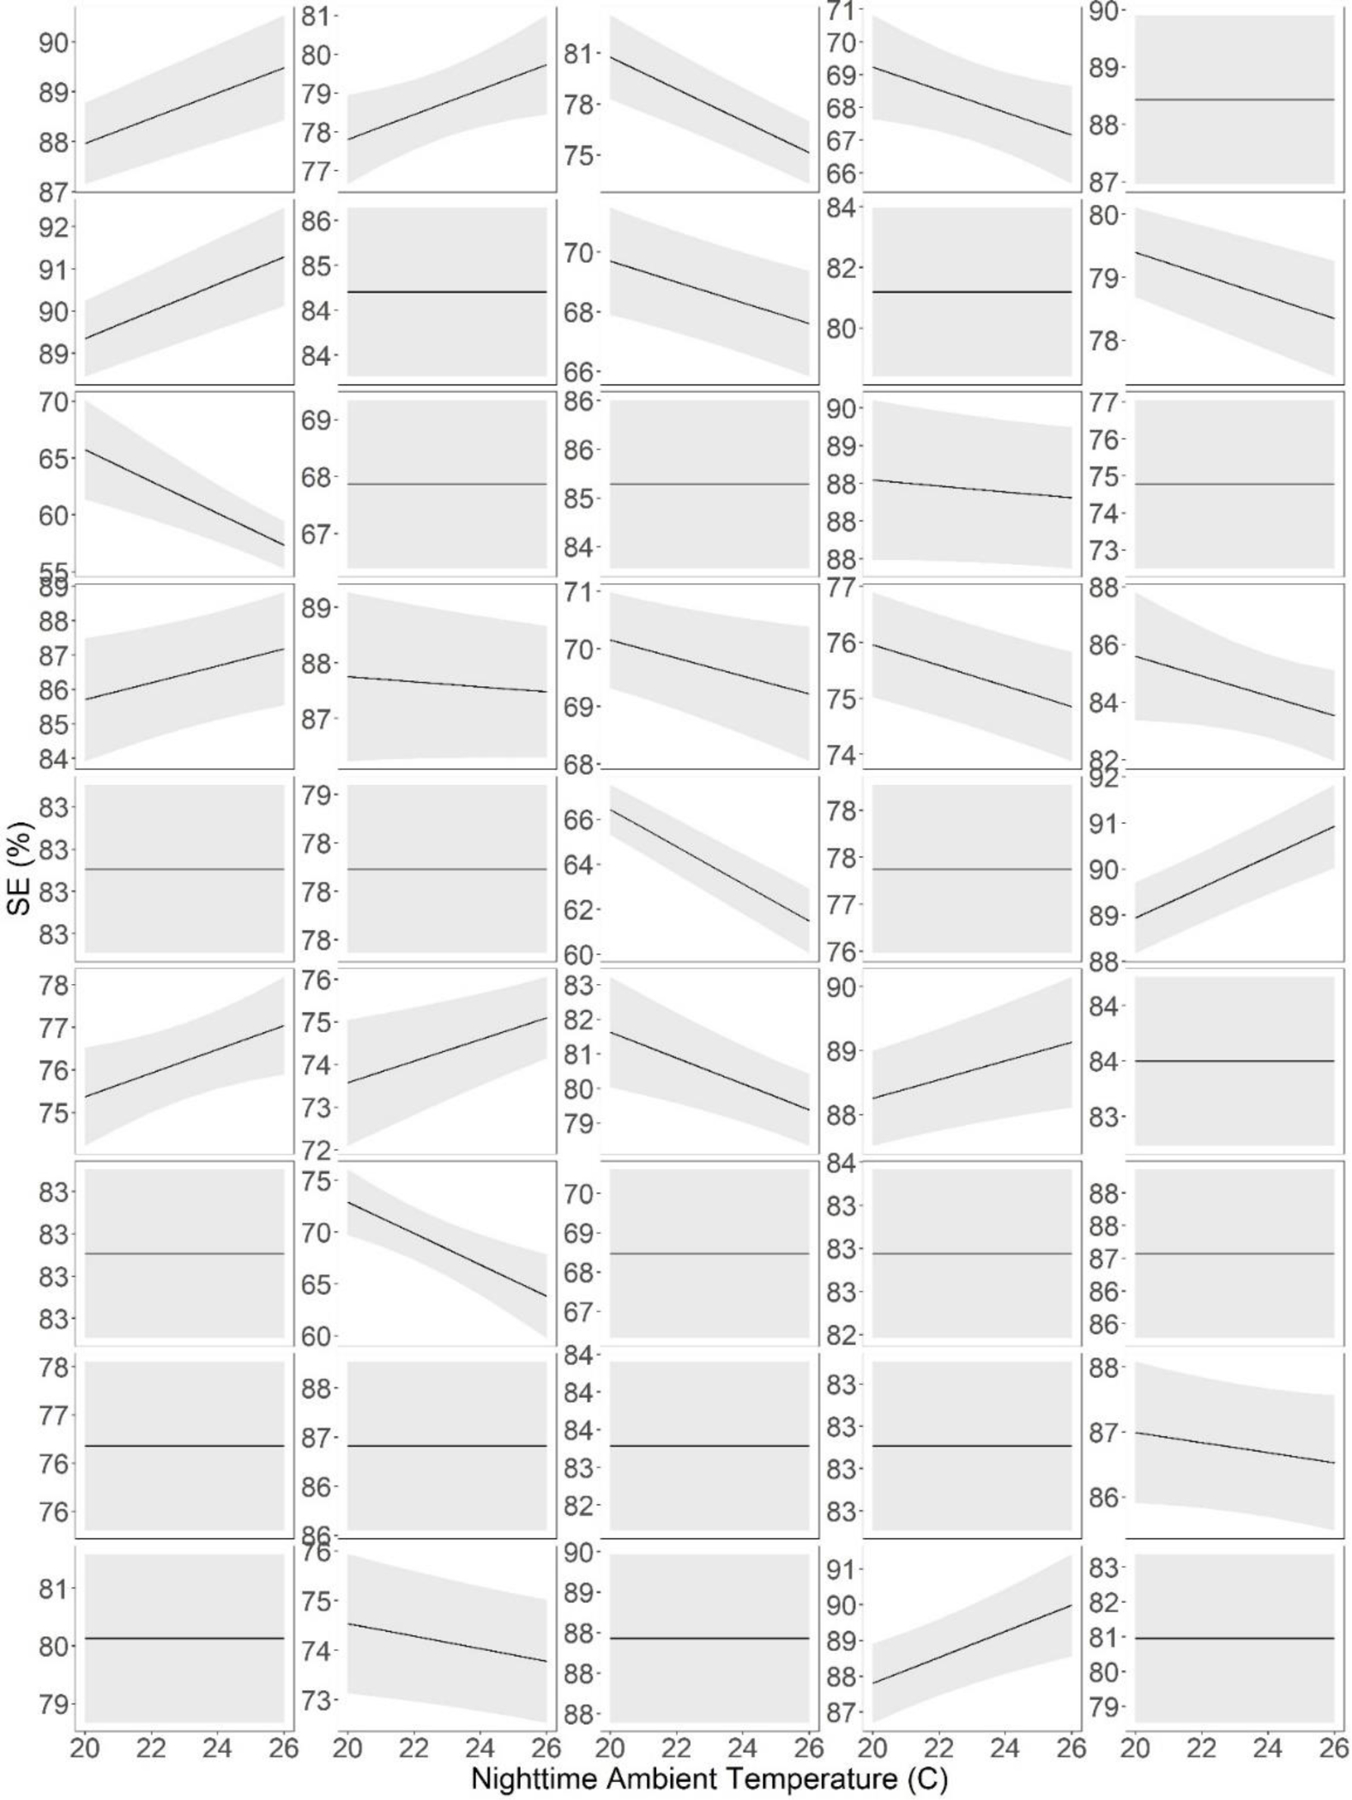
Figure 8.

Within-subject relationships between nighttime ambient temperature and Sleep Efficiency (SE) adjusting for day of the week, nighttime relative humidity, and day length. Each panel represents data from a specific participant. Note the vertical axis varies between panels. Unlike figure 7, nighttime temperature in these graphs is limited to 20–26 because we had fewer observations outside this range from any given individual. These data suggest the strength and even the direction of relationship between ambient temperature and SE may vary between subjects.
