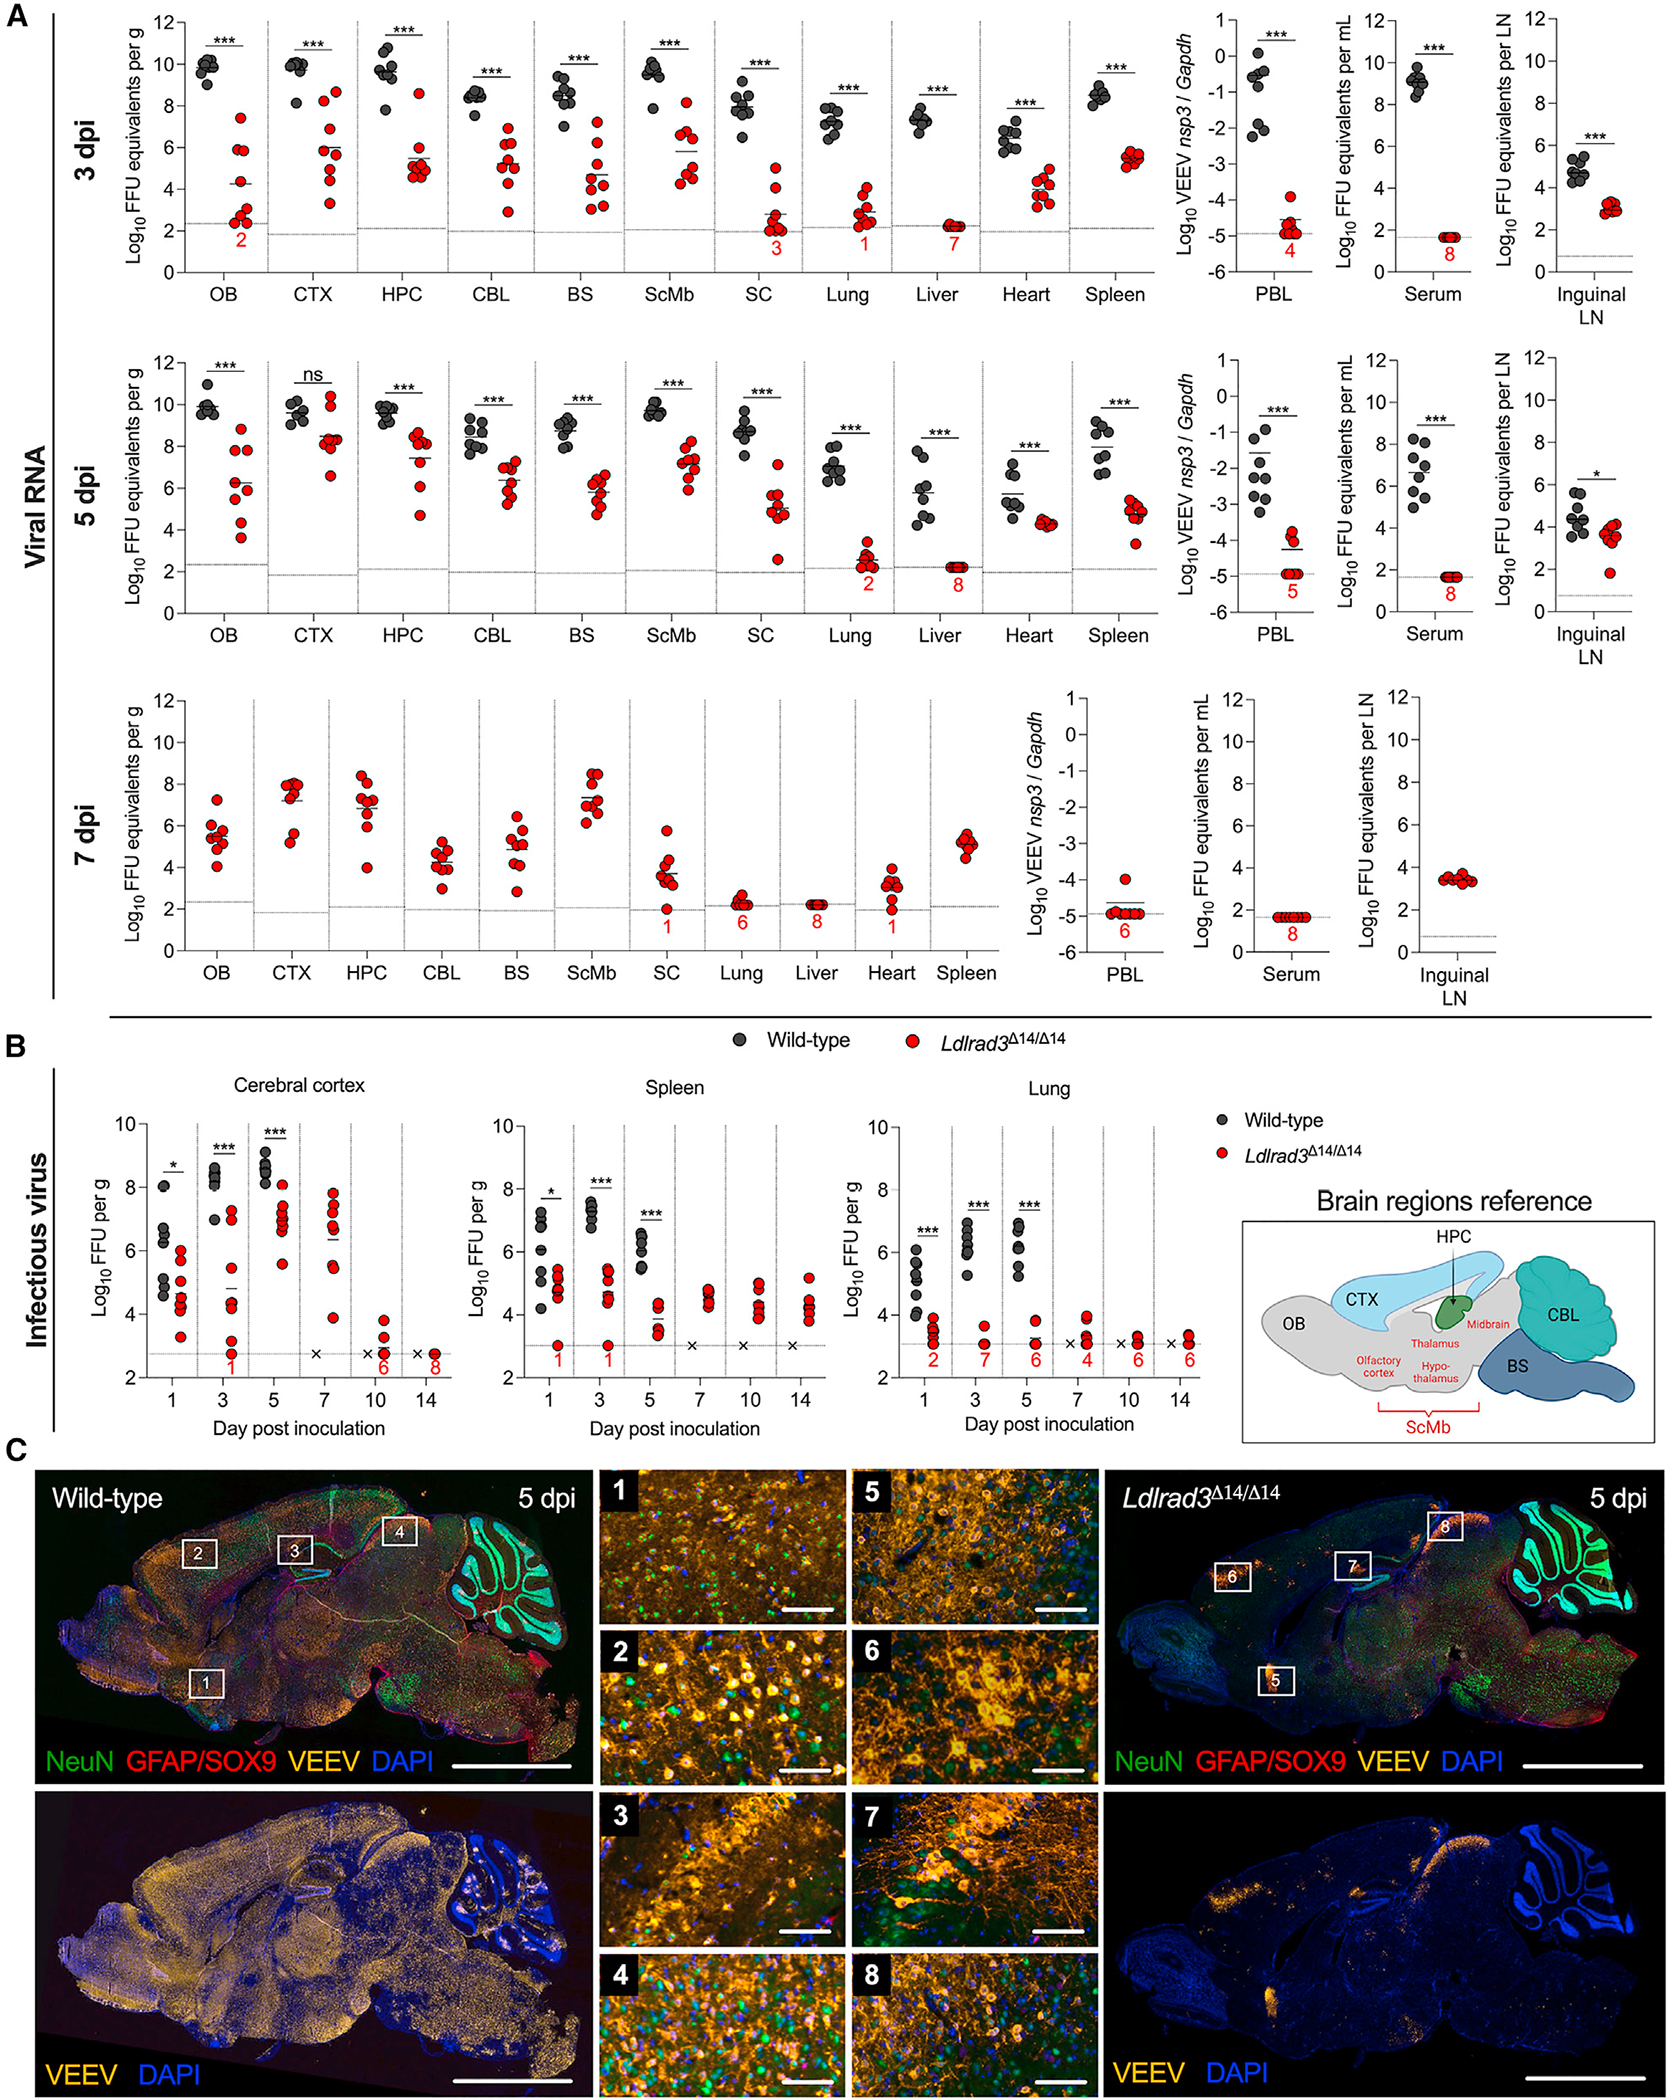
Figure 5. Kinetics of VEEV infection in Ldlrad3Δ14/Δ14 mice after intracranial inoculation.

(A and B) Wild-type or Ldlrad3Δ14/Δ14 (n = 8) mice were inoculated intracranially with 102 FFU of VEEV ZPC738.
(A) At 3, 5 (for wild-type and Ldlrad3Δ14/Δ14 mice), or 7 dpi (Ldlrad3Δ14/Δ14 mice only), indicated tissues and samples were assessed for VEEV RNA as described in Figure 1 (OB, CTX, HPC, CBL, BS, ScMbs, SC, PBLs, LN).
(B) For CTX, spleen, and lung samples, infectious virus was determined at each time point. Mean values are shown. The LOD for each tissue is indicated by a dashed line, and numbers in black or red enumerate samples with titers at the LOD. Data are from three independent experiments per time point and were analyzed by Mann-Whitney test (ns, not significant; *p < 0.05 and ***p < 0.001).
(C) Representative images of sagittal brain sections from wild-type or Ldlrad3Δ14/Δ14 mice (n = 4) harvested 5 days after intracranial inoculation with 102 FFU of VEEV ZPC738 (scale bars: 5 mm) and combination FISH for VEEV RNA, immunohistochemical staining for cell-type-specific antigens, and DAPI counterstaining for nuclei visualization. White boxes indicate enlarged insets: (1)–(4) insets are for wild-type and (5)–(8) insets are for Ldlrad3Δ14/Δ14 brains (scale bars: 100 mm). Data are representative of images from two experiments. Cartoon schematic of an annotated sagittal mouse brain section is included for reference and was generated using BioRender.
See also Figures S5 and S6.
