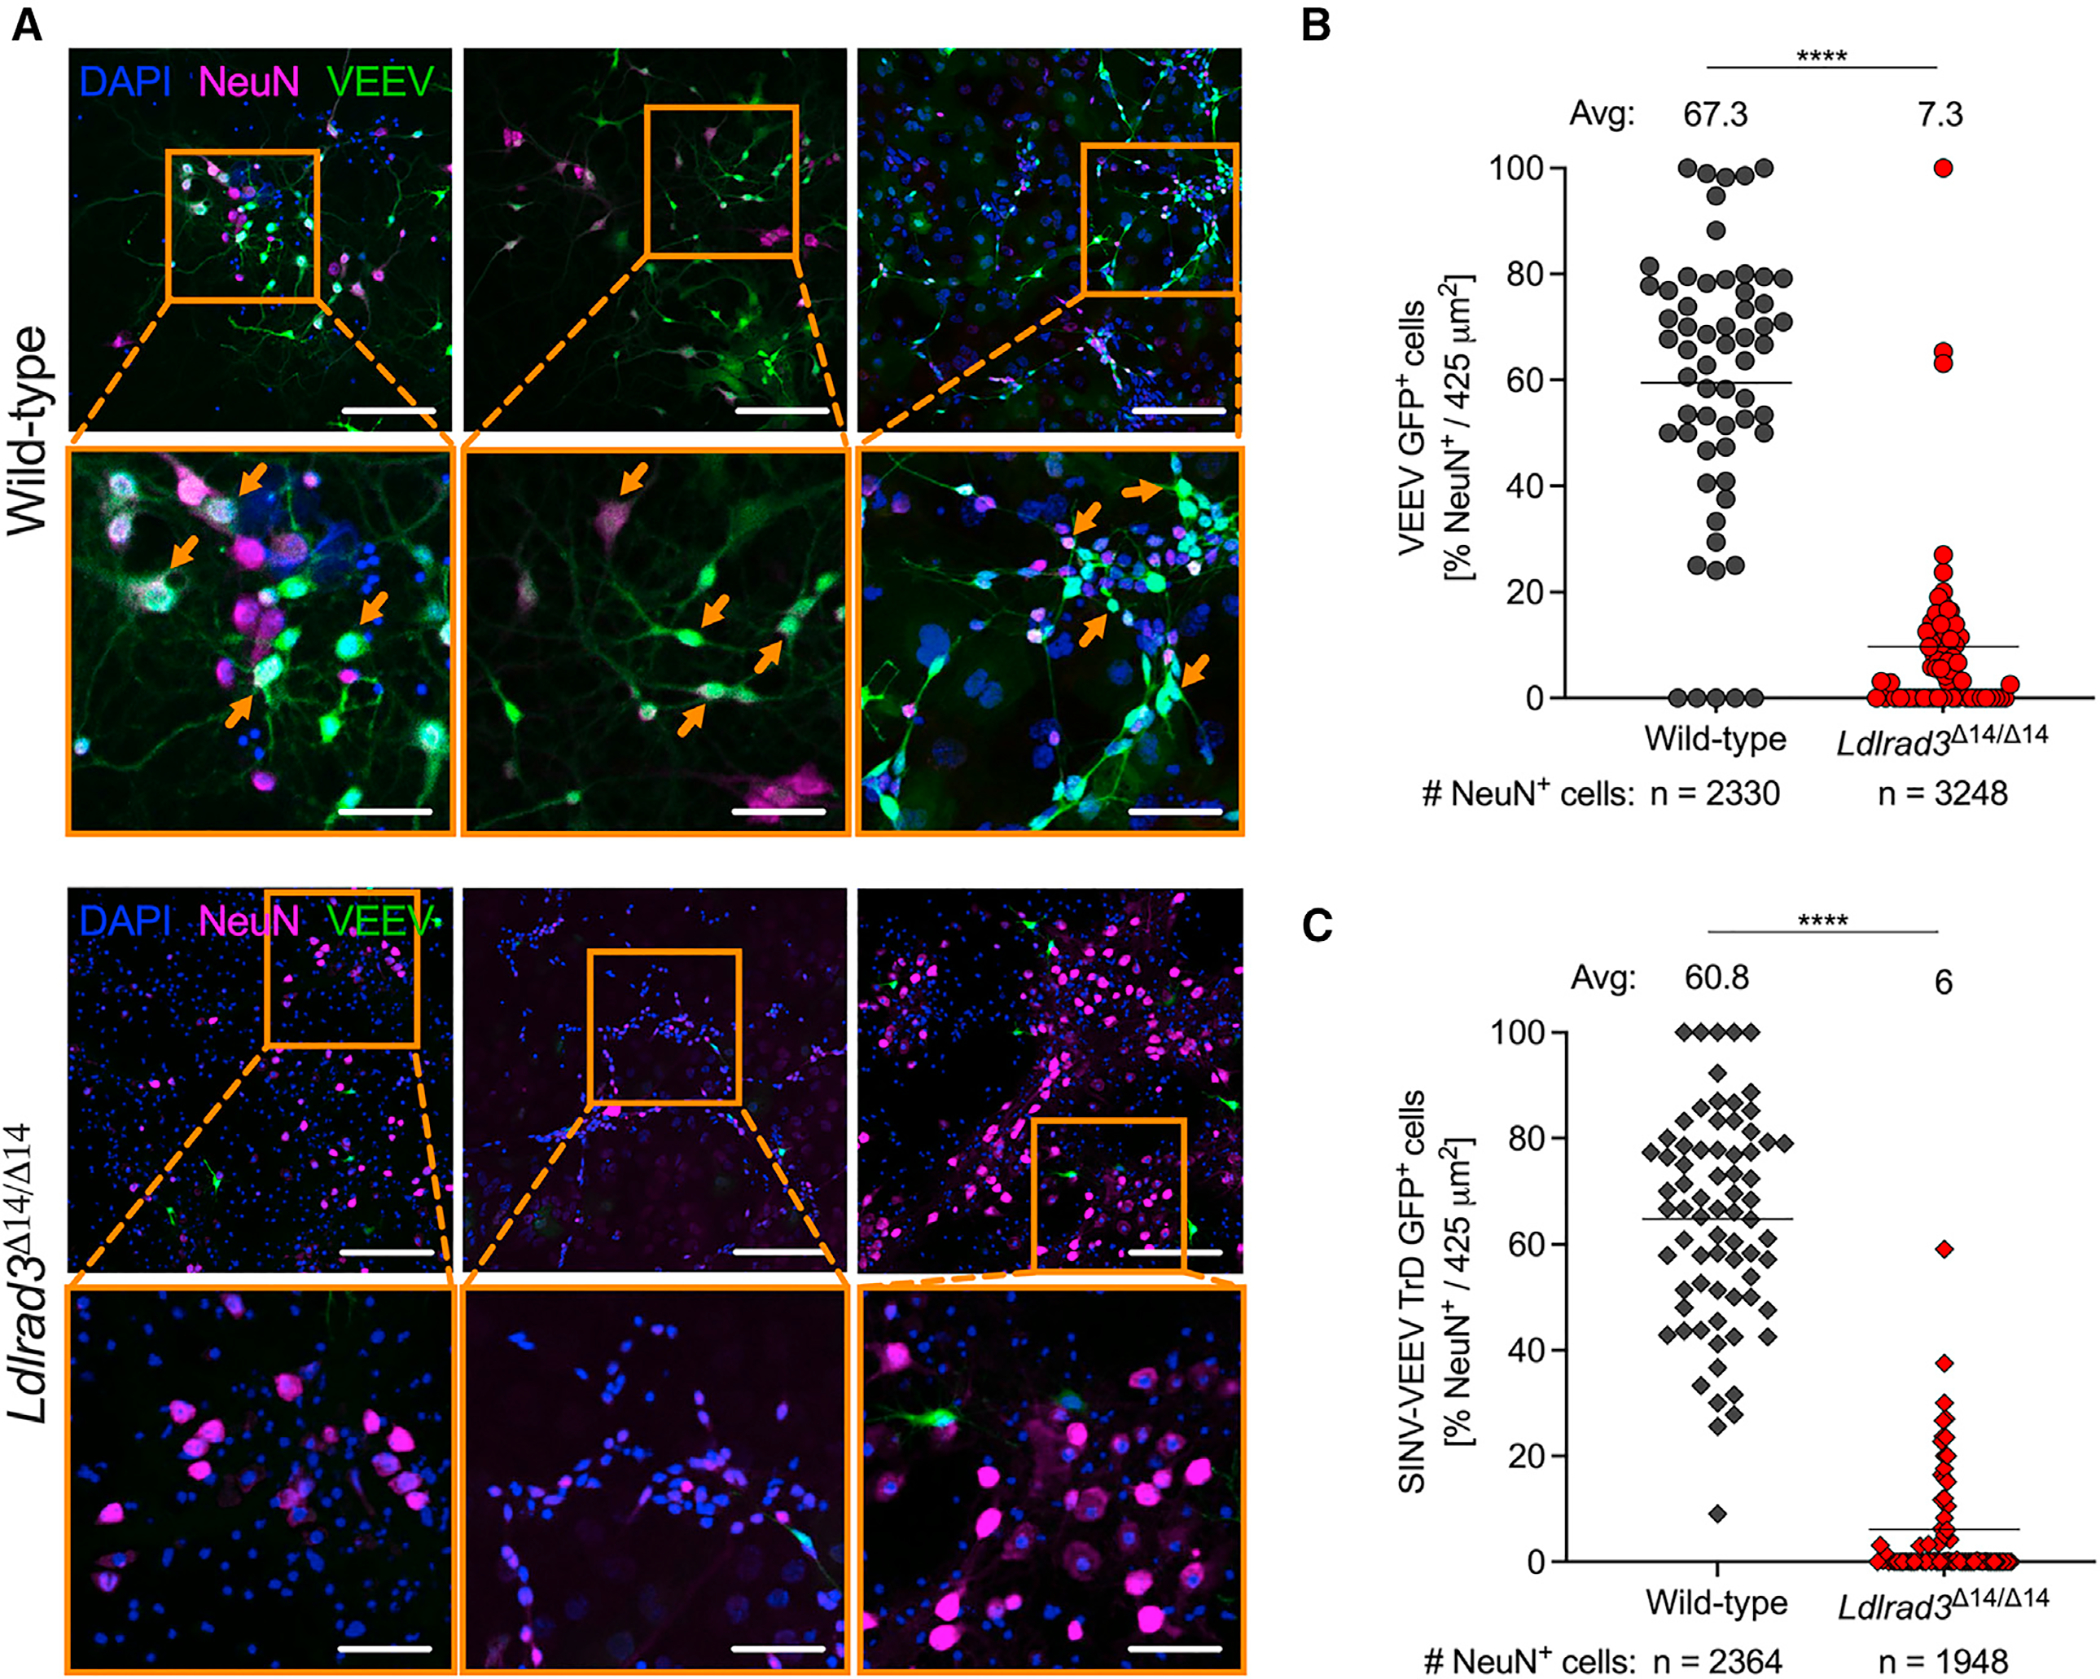
Figure 6. VEEV infection of neurons in primary mixed neuron-glia cultures.

(A–C) Immunofluorescence analysis of VEEV-EGFP- or SINV-VEEV TrD-GFP-infected NeuN+ neurons in mixed neuron-glia cultures isolated from embryonic day 17 (E17) embryos from wild-type and Ldlrad3Δ14/Δ14 mice and infected 11–14 days after plating at MOI 20 for 7 h.
(A) Representative confocal microscopy images of mixed neuron-glia cultures from wild-type (top panels) and Ldlrad3Δ14/Δ14 (bottom panels) fetuses highlighting nuclei (DAPI+), neurons (NeuN+), and VEEV infection (GFP+). Orange boxes indicate enlarged insets, and orange arrows indicate examples of infected neurons (NeuN+GFP+ co-localization) (low magnification, scale bars: 100 μm; high magnification, scale bars: 270 μm).
(B and C) Quantification of VEEV-infected neurons is represented per image area (425 μm2) as the percentage of NeuN+ cells that are GFP+ and infected with (B) VEEV ZPC738-EGFP or (C) SINV-VEEV TrD-GFP. The mean percentage of infected neurons is indicated above each dataset, and the total number of NeuN+ cells counted is indicated below. Data are from two independent experiments, each with three technical replicates, and were analyzed by Mann-Whitney test (****p < 0.0001).
See also Figure S7.
