
Figure 4. Defective activation of TCF1 cKO OTI T cells in the TDLN of poorly but not highly immunogenic tumors.
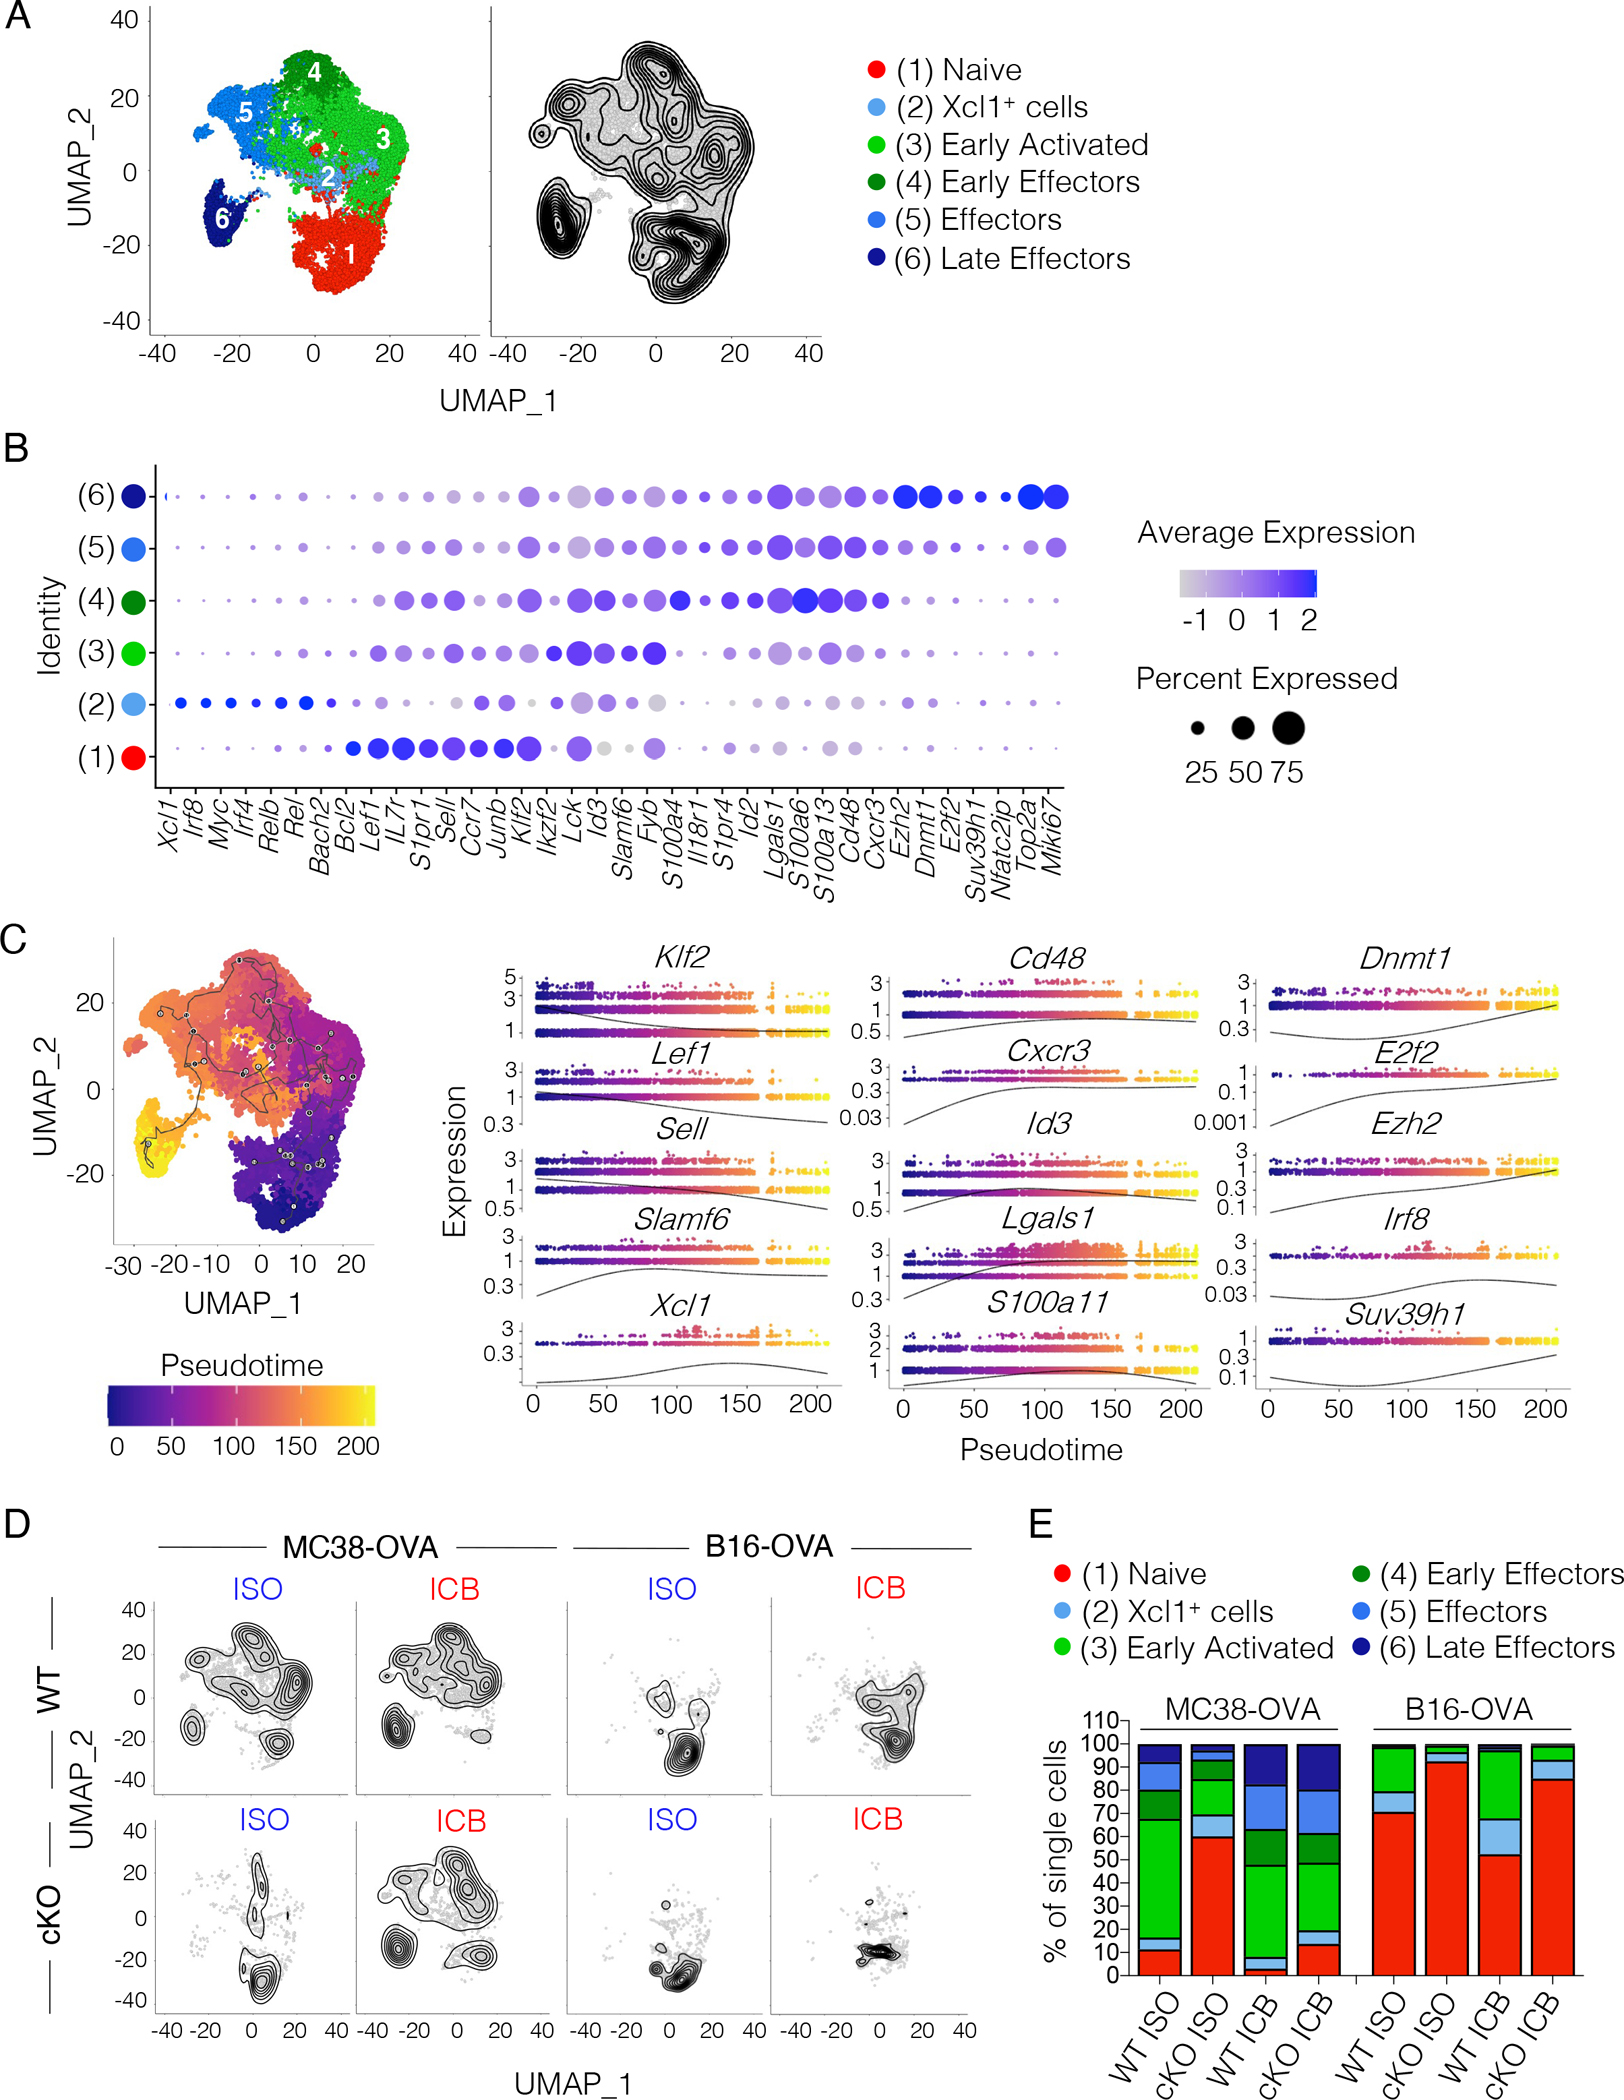
(A) Combined Uniform Manifold Approximation and Projection (UMAP) of single-cell transcriptomes from WT (n=3–5) and TCF1 cKO OTI T cells (n=3–5) sorted from the TDLN of B16-OVA- or MC38-OVA-bearing mice treated as shown in Figure 2A. Left, cluster annotation. Right, single-cell density. (B) Dot plot showing expression of cluster defining genes. Circle size indicates the percentage of cells expressing the gene in each cluster. Color scale indicates average gene expression level. (C) Pseudotime trajectory of single-cells (starting node: naïve cell cluster). Left, pseudotime projected on the UMAP. Right, expression profiles of selected genes along the pseudotime. (D) Single-cell density in WT or TCF1 cKO OTI T cells sorted from the TDLN of MC38-OVA- or B16-OVA-bearing mice treated as in Figure 2A. (E) Frequency of single-cells in each cluster and condition analyzed.