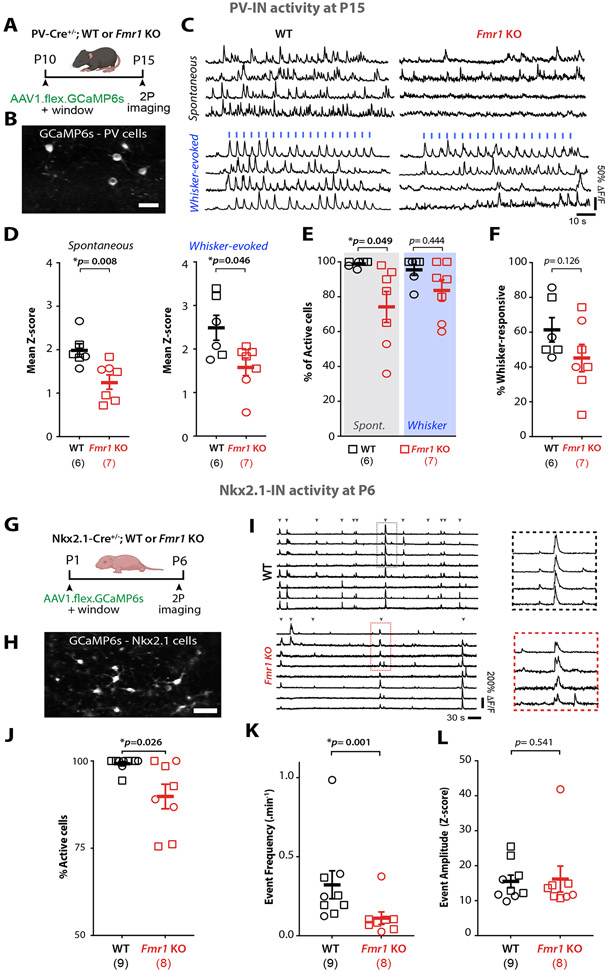
Figure 1: PV-INs and their MGE-derived immature INs are hypoactive in S1 of developing Fmr1 KO mice.
A. Cartoon of experimental design.
B. Example field of view of PV-INs expressing AAV1-flex-GCaMP6s in S1 cortex of PV-Cre mice (scale=25μm).
C. Representative traces of PV-IN calcium transients in WT and Fmr1 KO mice. Whisker stimulation (blue bars, 1s at 10 Hz, 3 s I.S.I).
D. Mean Z-scores of PV-INs at P15 are significantly lower in Fmr1 KO than in WT mice. In panels D-F and J-L, symbols represent individual mice (sample size in parenthesis, females=circles, males=squares. (spontaneous: 1.98±0.15 for WT vs. 1.28±0.17 for Fmr1 KO; whisker-evoked: 2.49±0.29 for WT vs. 1.61±0.21 for Fmr1 KO, respectively; p=0.008 and p=0.046, M-W t-test, n=6 WT and n=7 Fmr1 KO mice).
E. Percentage of active PV-INs in WT and Fmr1 KO mice (spontaneous: 98.9±0.8% for WT vs. 74.2±8.9% for Fmr1 KO; p=0.049, whisker-evoked: 95.5±3.2% for WT vs. 83.6±6.1% for Fmr1 KO, p=0.444, M-W t-test).
F. Percentage of stimulus-locked PV-INs (61.4±6.9% for WT vs. 45.2±7.9% for Fmr1 KO; p=0.126, M-W t-test).
G. Experimental design for in vivo recordings at P6.
H. Example field of view of Nkx2.1-INs expressing AAV1-flex-GcaMP6s in S1 cortex Nkx2.1-Cre mice (scale =25μm).
I. Example calcium traces of Nkx2.1-INs in WT and Fmr1 KO mice. Inset shows expanded traces for representative synchronous network events.
J. The percentage of active Nkx2.1-INs at P6 was significantly lower in Fmr1 KO mice than in WT controls. (99.2±0.6% for WT and 89.8±3.5% for Fmr1 KO, n=9 and 8, respectively; p=0.026, MW t-test).
K. The frequency of synchronous network events for Nkx2.1-INs was significantly lower in Fmr1 KO mice. (0.32±0.09 events per min for WT vs. 0.11±0.04 for Fmr1 KO, n=9 WT and n=8 Fmr1 KO, p=1.4x10⁻³, MW t-test).
L. The amplitude of calcium transient events of Nkx2.1-INs was not different between genotypes (15.5±1.8 for WT vs. 16.2±3.7 for Fmr1 KO, p=0.541, MW t-test).

