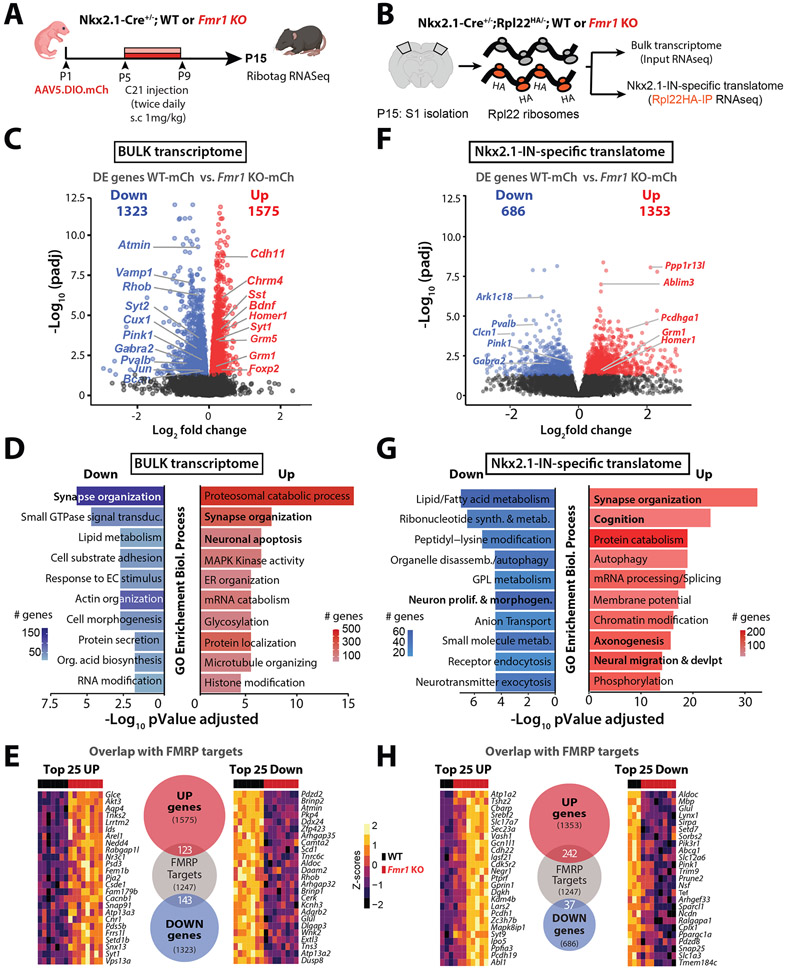
Figure 5: Bulk transcriptome and Nkx2.1-IN specific translatome is altered in P15 Fmr1 KO mice.
A. Experimental design for transcriptomic analysis at P15.
B. Cartoon of Ribotag approach for RNA-seq in S1 at P15.
C. Volcano plot of differentially expressed (DE) genes in the bulk RNA of Fmr1 KO-mCherry mice (n=8) compared to WT-mCherry (n=7).
D. Top 10 ‘GO terms’ of the bulk transcriptome in Fmr1 KO-mCherry mice using the biological process package (see Methods).
E. Number of DE genes in Fmr1 KO-mCherry mice within the bulk transcriptome dataset that are known targets of FMRP, based on previously published database (see Methods). Heatmaps represent the changes of expression as Z-scores among the top 25 upregulated and downregulated genes.
F. Volcano plot of DE genes in the Nkx2.1-IN-specific translatome of Fmr1 KO-mCherry mice (n=8) compared to WT-mCherry control (n=3).
G. Top 10 ‘GO terms’ in Nkx2.1-IN-specific translatome in Fmr1 KO-mCherry mice.
H. Number of DE genes in Fmr1 KO-mCherry mice within the Nkx2.1-specific translatome dataset that are known targets of FMRP (shown as in panel E).

